
Sea level trends, Norway
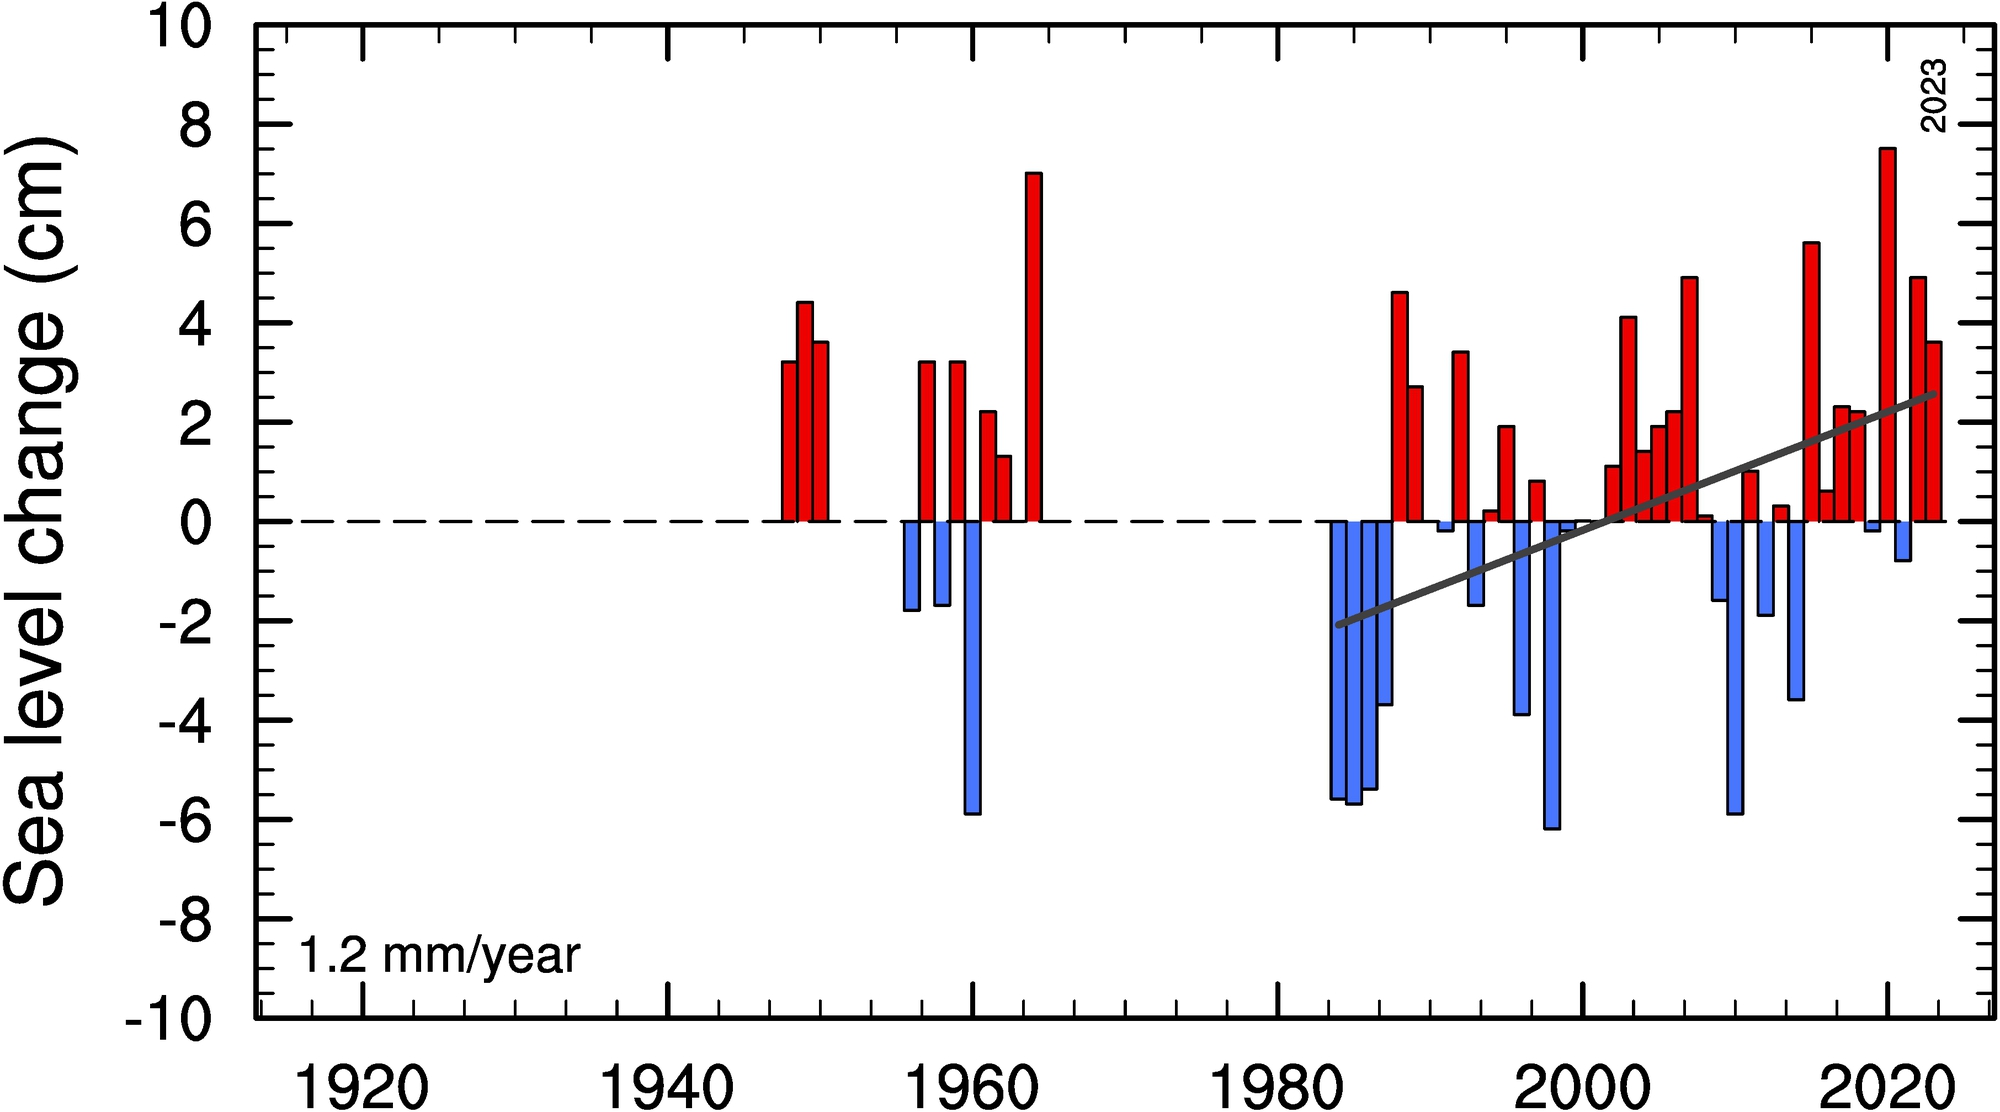
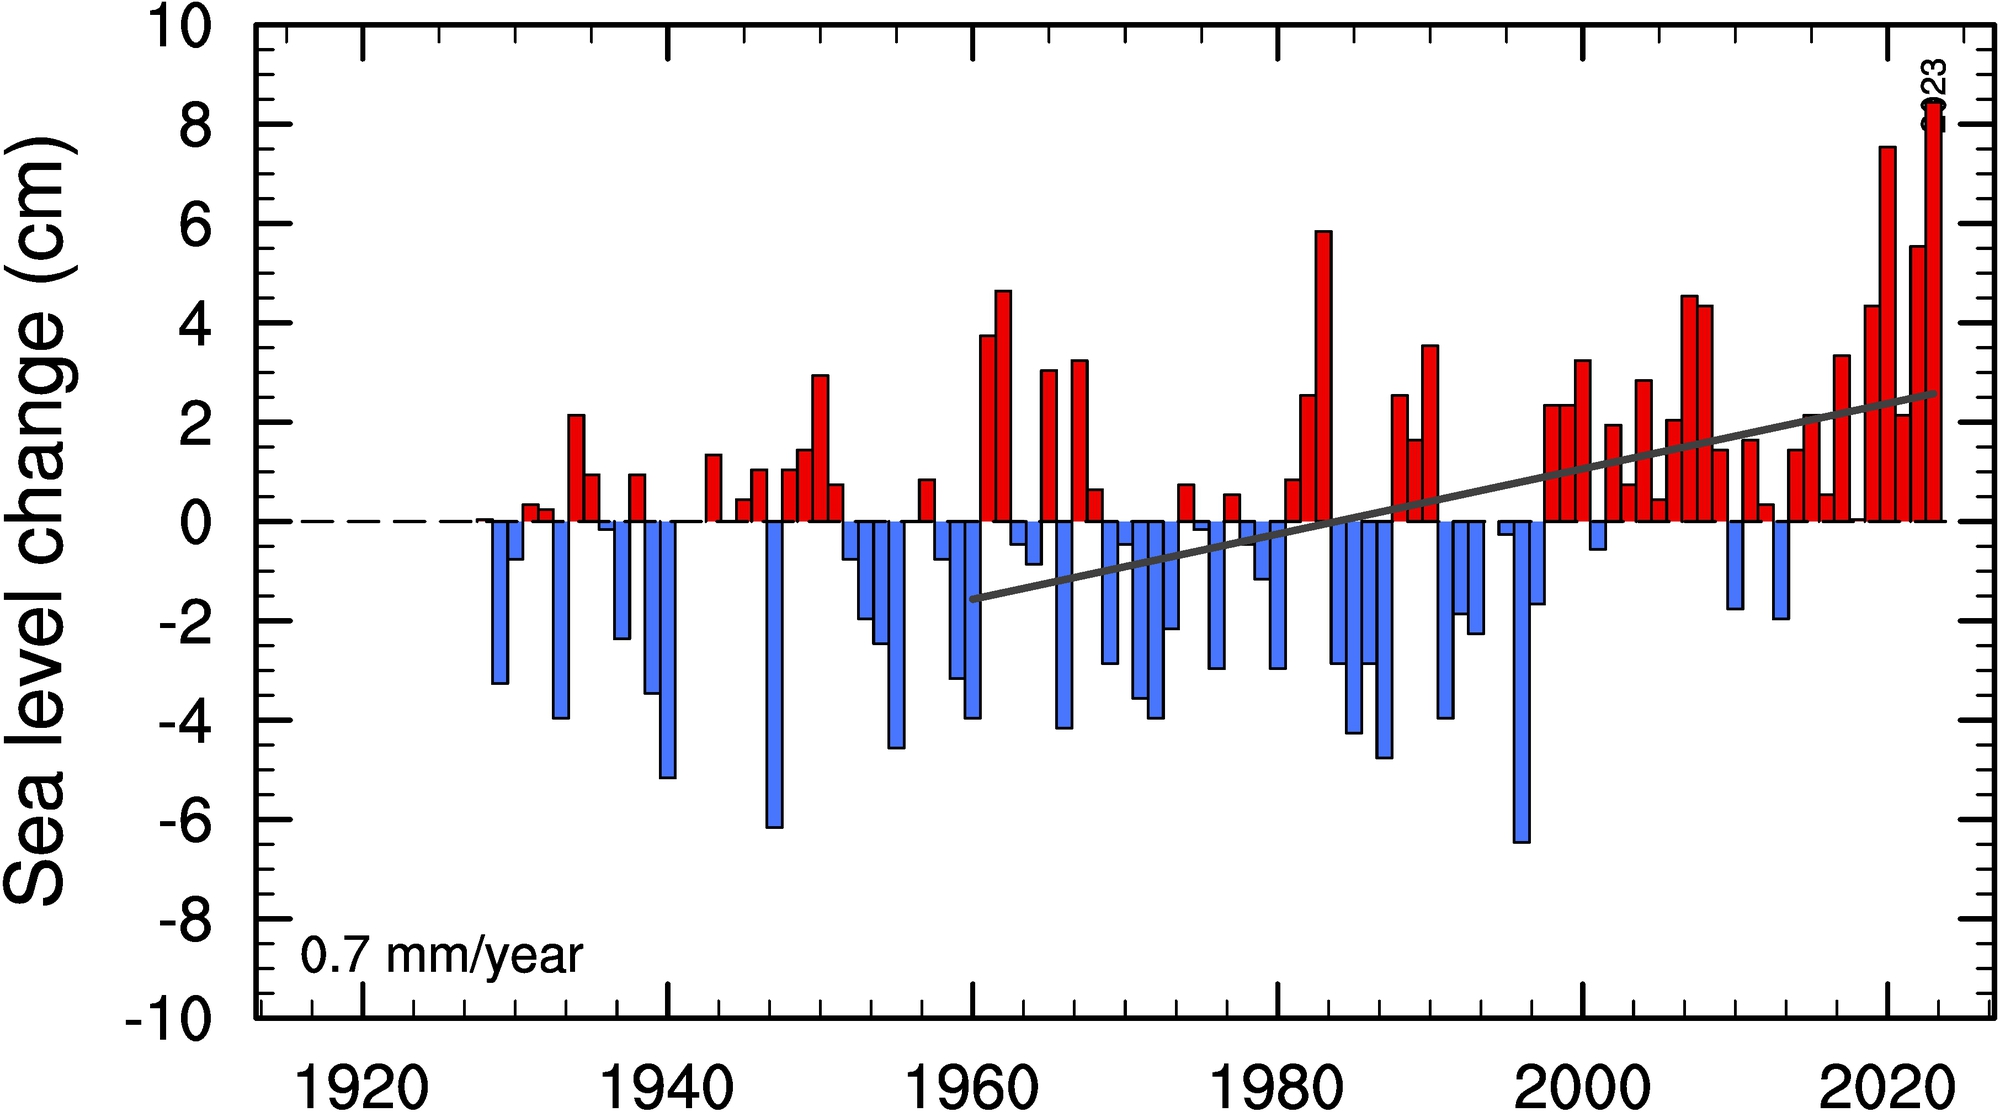
Trends in sea level (mm/year) since 1960 along the coast of Norway.
The bars display the observed sea level relative to land; red (blue) colors show stations with sea level rise (fall). The symbols show sea level in the open ocean (ignoring land uplift), with the horisontal line displaying a mean sea level of 3.0 mm/year off the coast of Norway (the average value of the symbols).
Only stations with at least 30 years of annual mean data between 1960-2011 are included in the analysis.
See Richter et. al. (2012) for an analysis of observed variations in the sea level along the Norwegian coast for the period 1960-2010.
Map of stations and
figure with only bars.
 Sea level data from Permanent Service for Mean Sea Level provided by Kartverket.
Land uplift data from Vestøl (2006).
Note: Errors may occur since all figures are automatically updated with only sporadic checking.
Return to Sea level overview. Return to top of page.


