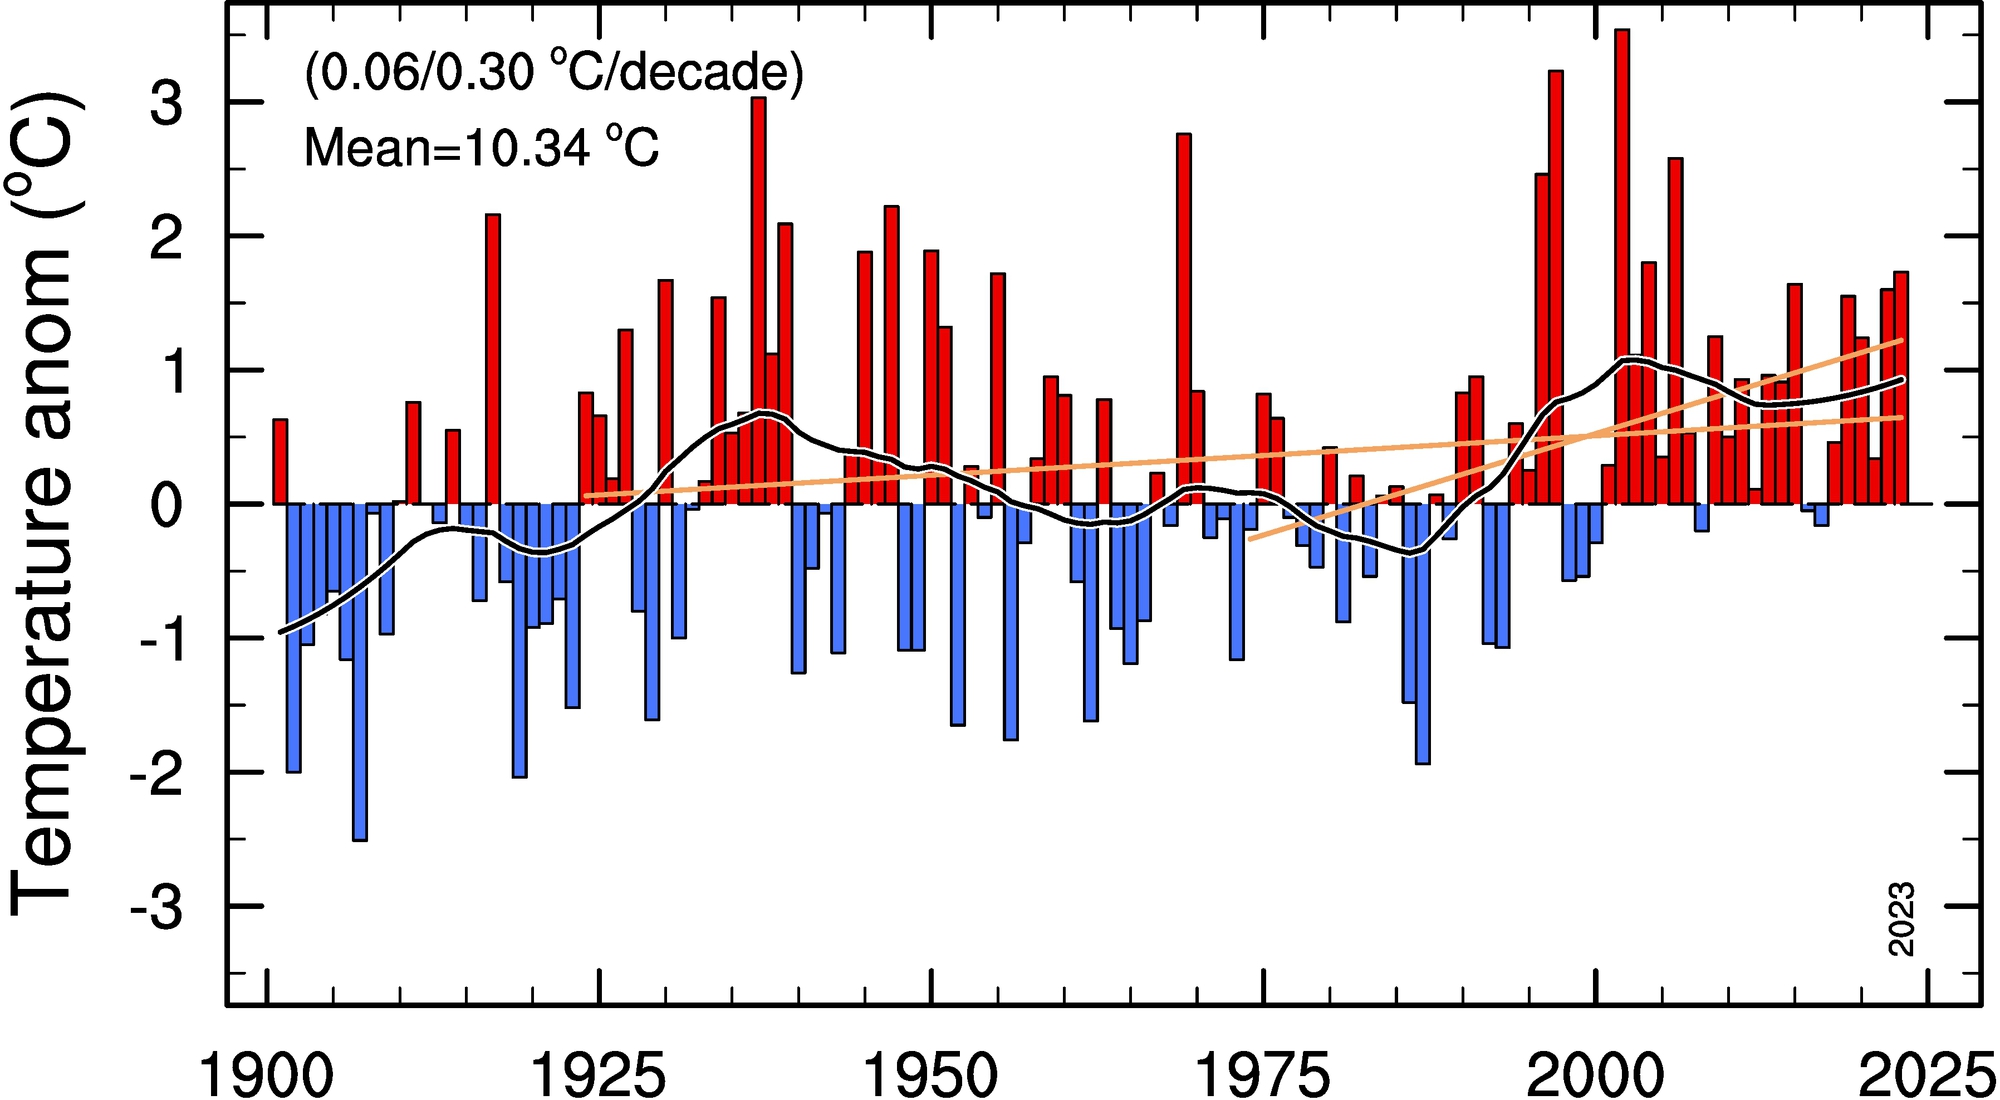
Annual mean temperature, Norway

Observed change of annual mean temperature for Norway since year 1900, relative to the 1901-2000 mean. The trend lines (grey colour) show the linear trends for the last 100 and 50 years. The string
    (X/Y °C/decade)
gives the associated 100 year and 50 year linear slopes in degrees Centigrade per decade.
    Mean = ...
gives the mean temperature for the period 1901-2000 (the zero-line in the figure).
Last data point is given in the lower right corner of the figure.

Data from Frost of the Norwegian Meteorological Instutute.
Note: Errors may occur since all figures are automatically updated with only sporadic checking.
Return to Temperature overview. Return to top of page.

Based on the observed temperature time series as shown above, a projection until year 2100 is constructed based on an adjusted version of the IPCC AR6 (2021) SSP2-4.5 scenario with a constrained warming of +1.4 deg C between year 2000 and 2100 plus random shuffeling of the observed temperature anomalies during the last 100 years.

Data from Frost of the Norwegian Meteorological Instutute.
Note: Errors may occur since all figures are automatically updated with only sporadic checking.
Return to Temperature overview. Return to top of page.

Overview, temperature, Norway

As for the observed temperature series above, but for the annual mean temperature (left column) and for the individual months of the year. Upper figure shows the actual temperature, the following figure the temperature anomaly relative to the 1901-2000 mean. The latter is indicated with the transition between the two red colours. The black and blue lines are the linear trends for the last 100 and 50 years, respectively.

Data from Frost of the Norwegian Meteorological Instutute.
Note: Errors may occur since all figures are automatically updated with only sporadic checking.
Return to Temperature overview. Return to top of page.

Annual mean temperature, including current year until last month

As above, but including the mean of all months of the current year. Latest month included is indicated in the lower right corner of the figure.

Data from Frost of the Norwegian Meteorological Instutute.
Note: Errors may occur since all figures are automatically updated with only sporadic checking.
Return to Temperature overview. Return to top of page.

Summer (May to September) mean temperature, Norway

As above, but for the five summer months May to September. Last summer is denoted in the lower right corner of the figure.

Data from Frost of the Norwegian Meteorological Instutute.
Note: Errors may occur since all figures are automatically updated with only sporadic checking.
Return to Temperature overview. Return to top of page.

Winter (November to March) mean temperature, Norway

As above, but for the five winter months November to March. The year is given for the latter part of the winter, i.e., for January-March.

Data from Frost of the Norwegian Meteorological Instutute.
Note: Errors may occur since all figures are automatically updated with only sporadic checking.
Return to Temperature overview. Return to top of page.

Seasonal mean temperature, Norway

Observed change of seasonal mean temperature for Norway since year 1900, relative to the 1901-2000 mean. The trend lines (grey colour) show the linear trends for the last 100 and 50 years. The string
    (X/Y °C/decade)
gives the associated 100 year and 50 year linear slopes in degrees Centigrade per decade.
    Mean = ...
gives the mean temperature for the period 1901-2000 (the zero-line in the figures).
Last data point in the lower right corner of the figures.


December-January-February March-April-May
June-July-August September-October-November

Data from Frost of the Norwegian Meteorological Instutute.
Note: Errors may occur since all figures are automatically updated with only sporadic checking.
Return to Temperature overview. Return to top of page.

Monthly mean temperature, Norway

Observed change of monthly mean temperature for Norway since year 1900, relative to the 1901-2000 mean. The trend lines (grey colour) show the linear trends for the last 100 and 50 years. The string
    (X/Y °C/decade)
gives the associated 100 year and 50 year linear slopes in degrees Centigrade per decade.
    Mean = ...
gives the mean temperature for the period 1901-2000 (the zero-line in the figures).
Last data point in the lower right corner of the figures.


January February
March April
May June
July August
September October
November December

Data from Frost of the Norwegian Meteorological Instutute.
Note: Errors may occur since all figures are automatically updated with only sporadic checking.
Return to Temperature overview. Return to top of page.

Long-term temperature observations, Norway

Click on the marked locations to obtain graphs of observed temperature.

Norway Bergen Oslo Roeros Dombaas Aas Ona Utsira Lista Torungen Faerder Nesbyen Laerdal Skrova Tromsoe Karasjok Vardoe JanMayen Svalbard

Return to Temperature overview. Return to top of page.