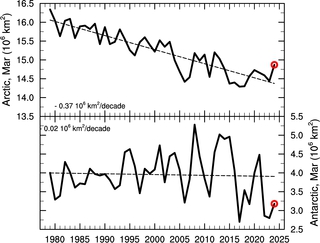
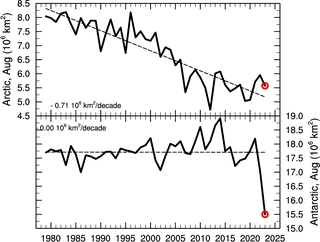
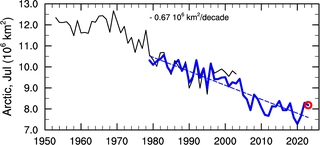
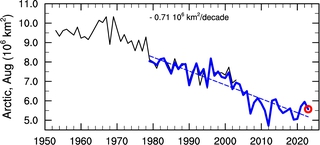
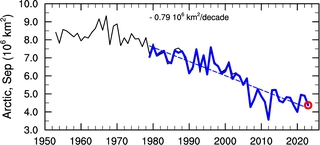
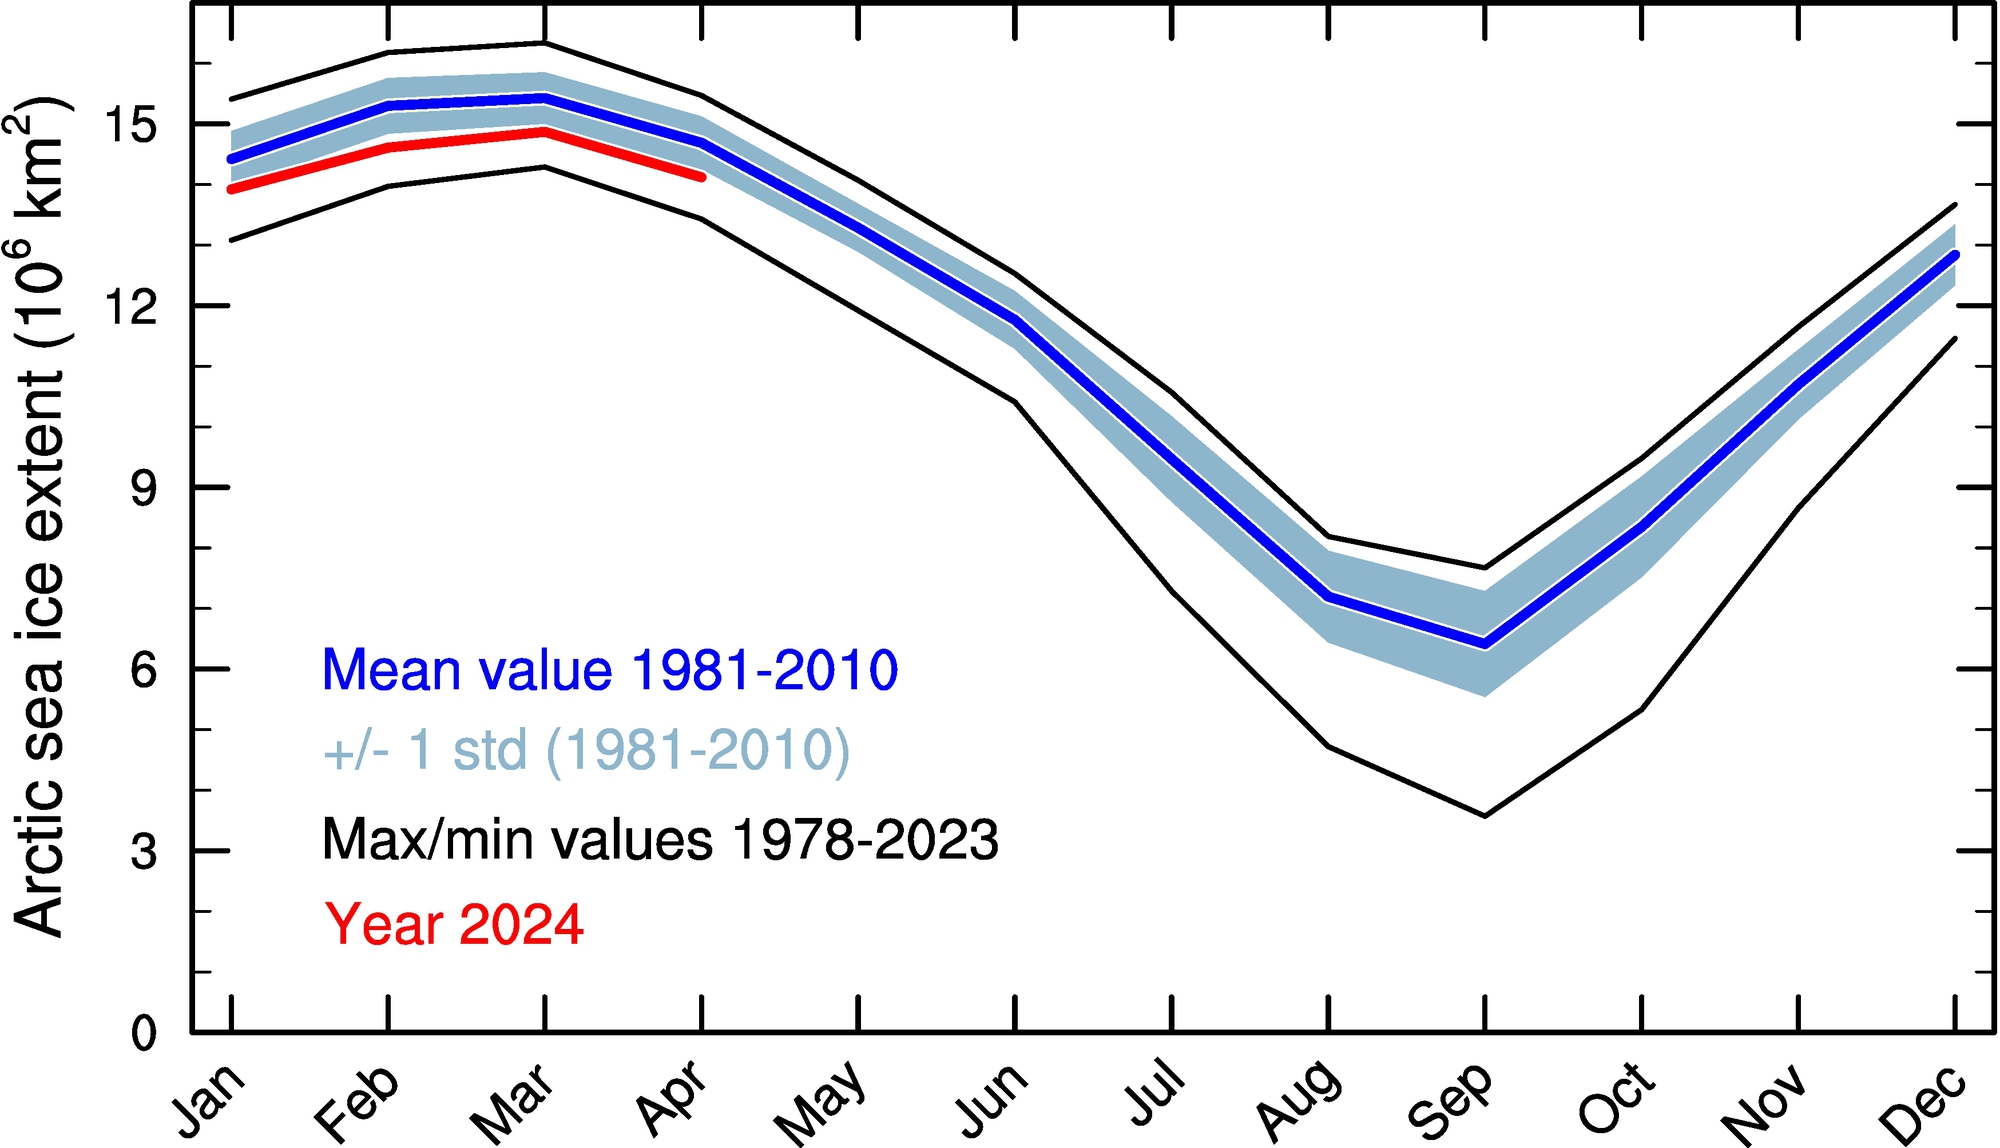
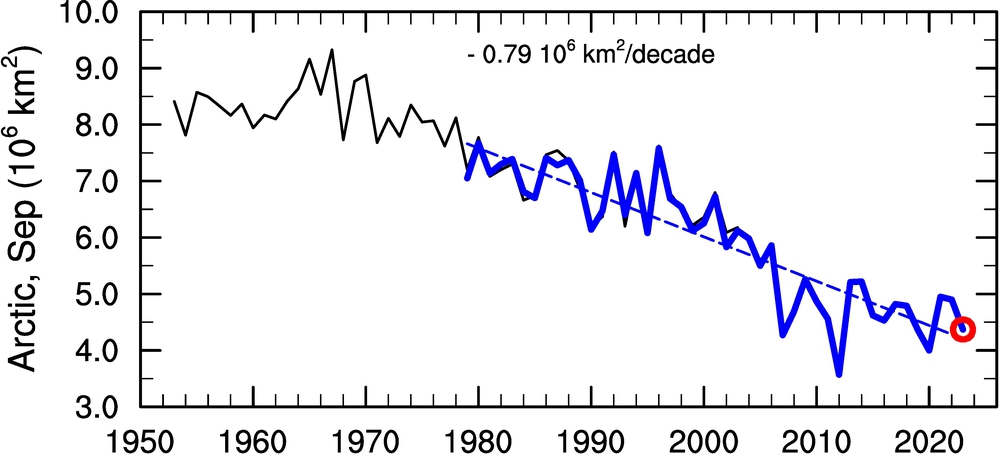
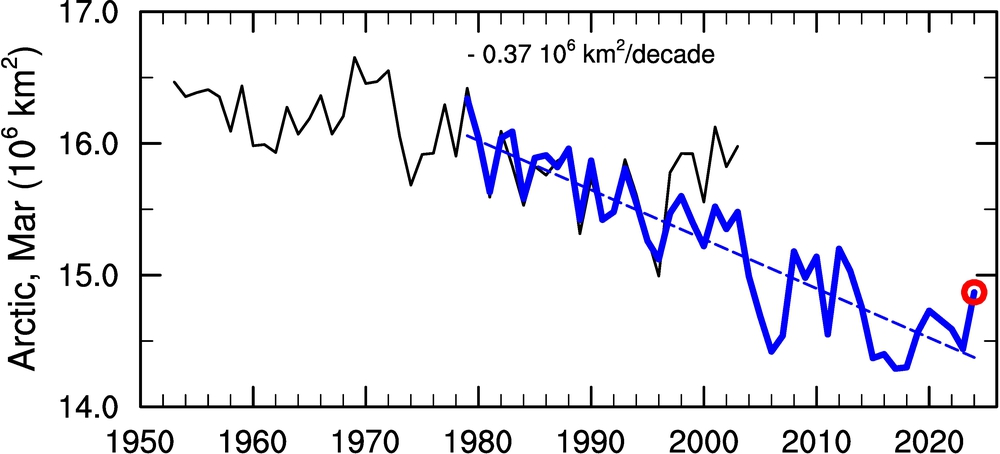
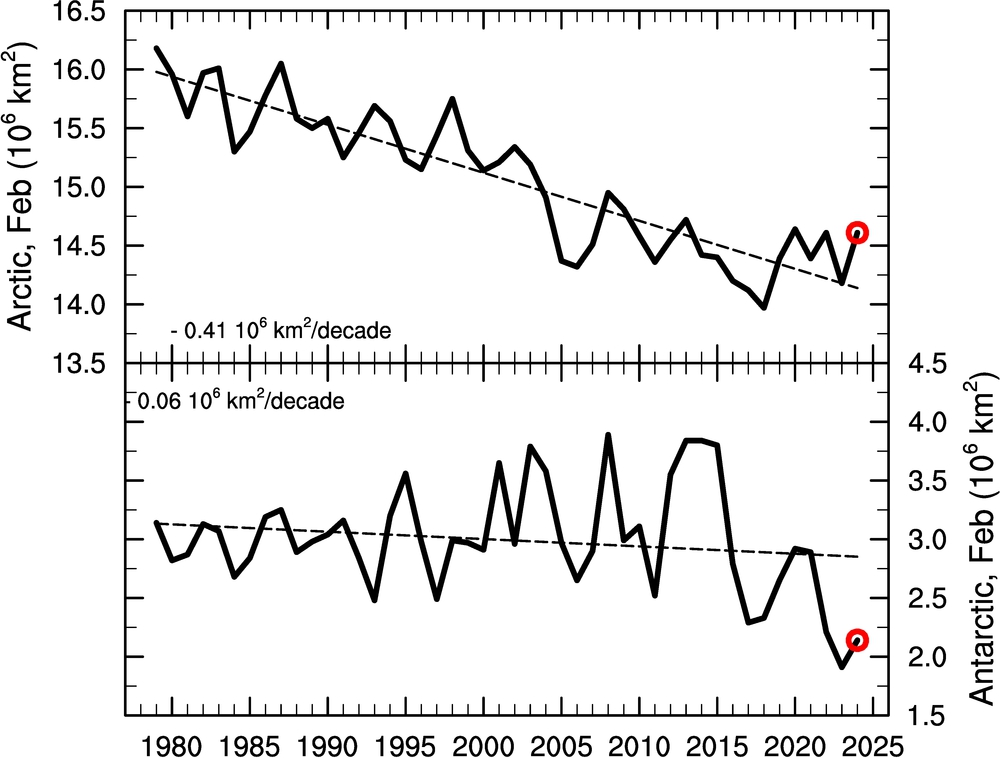
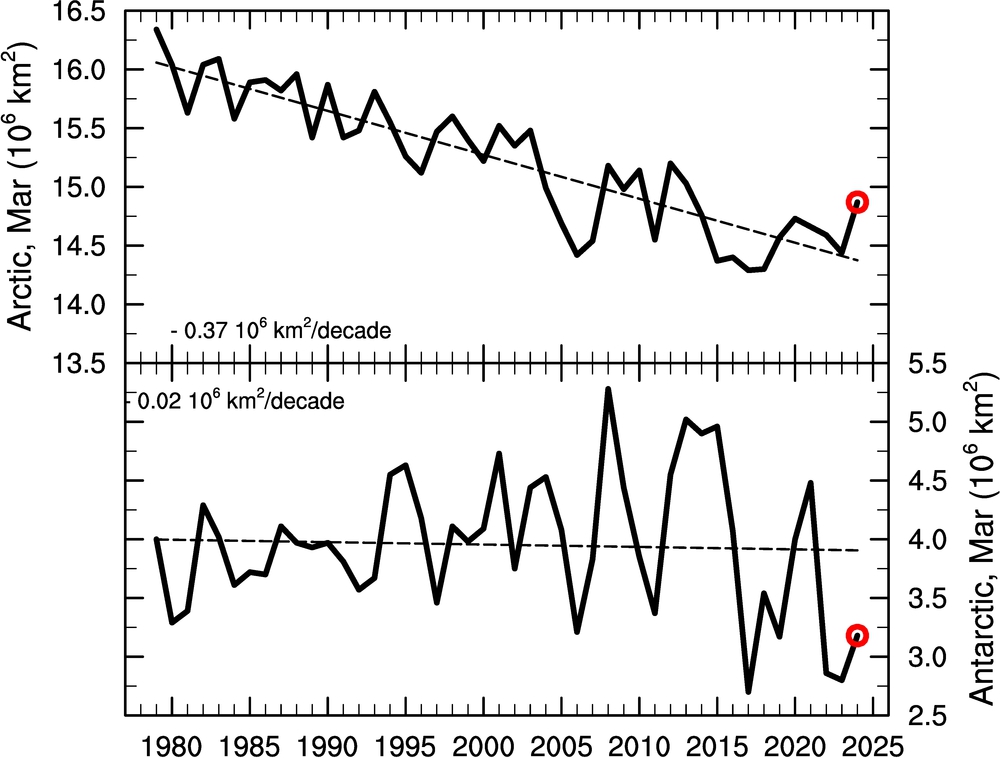
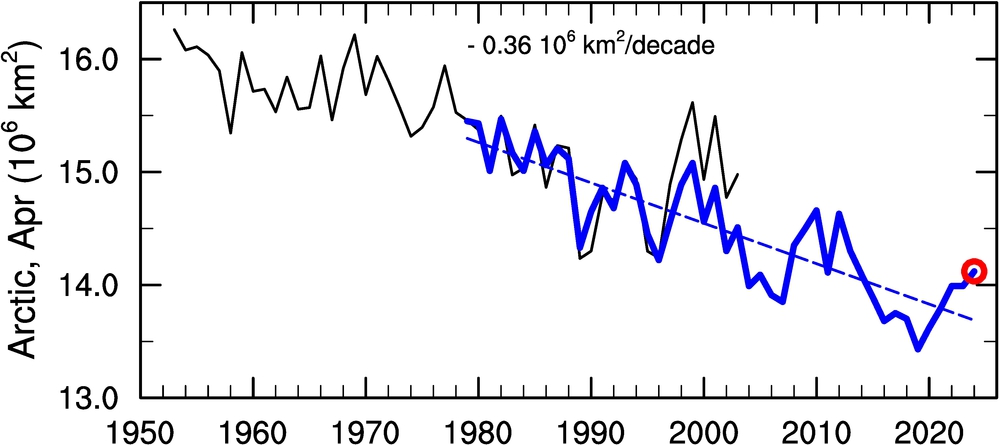
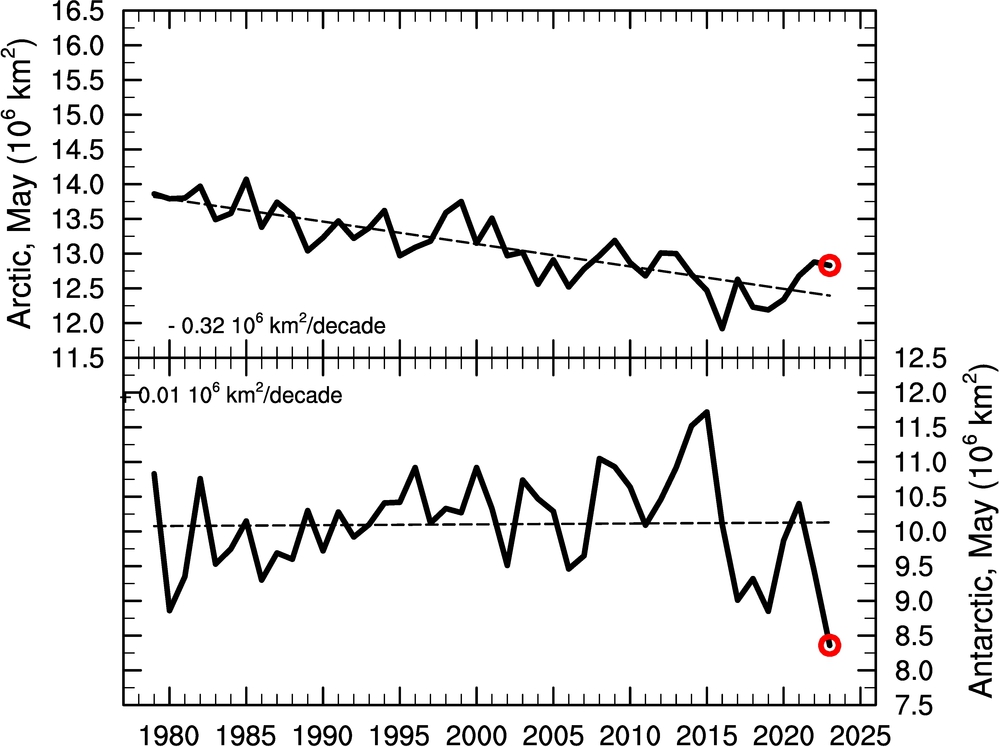
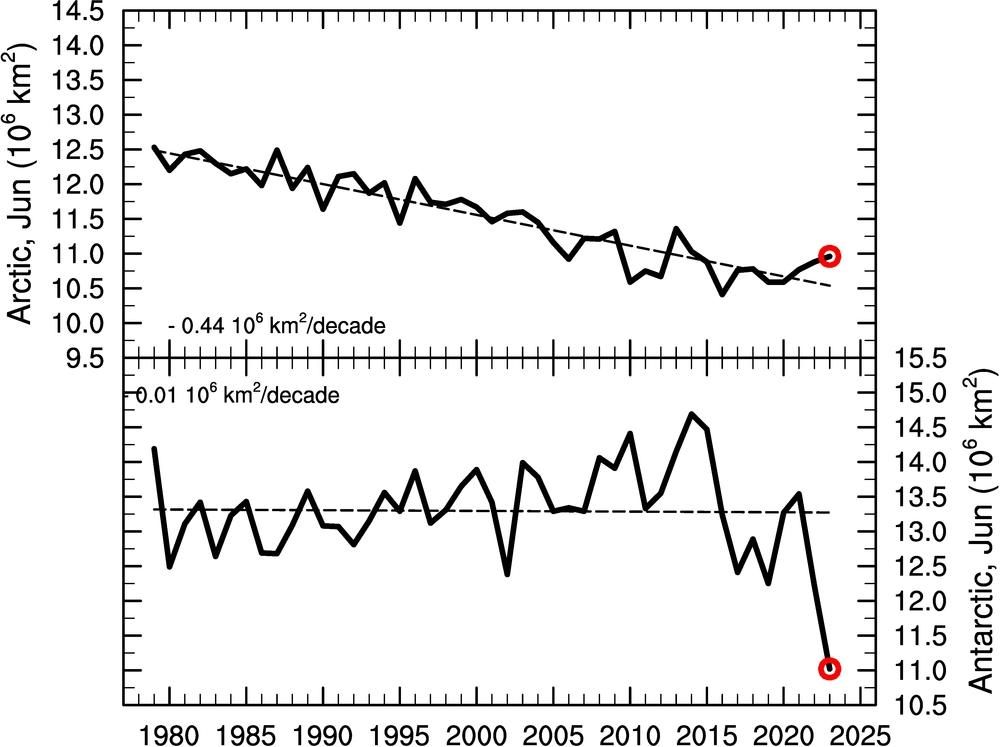
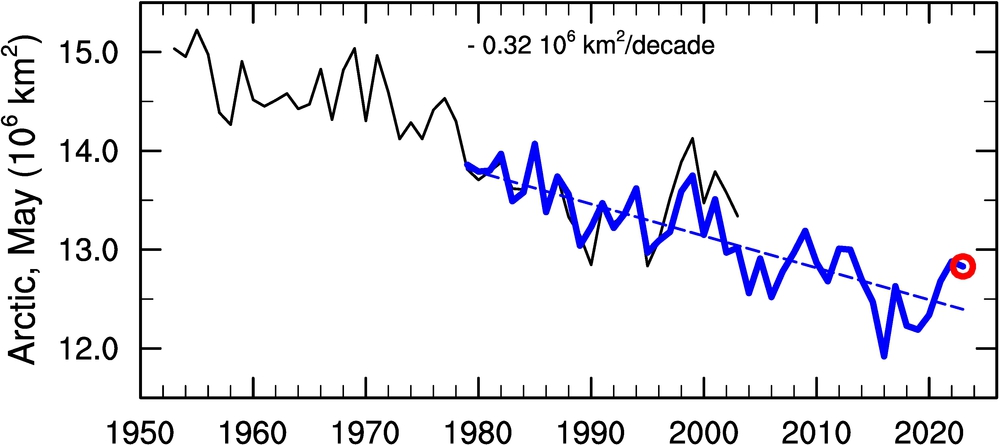
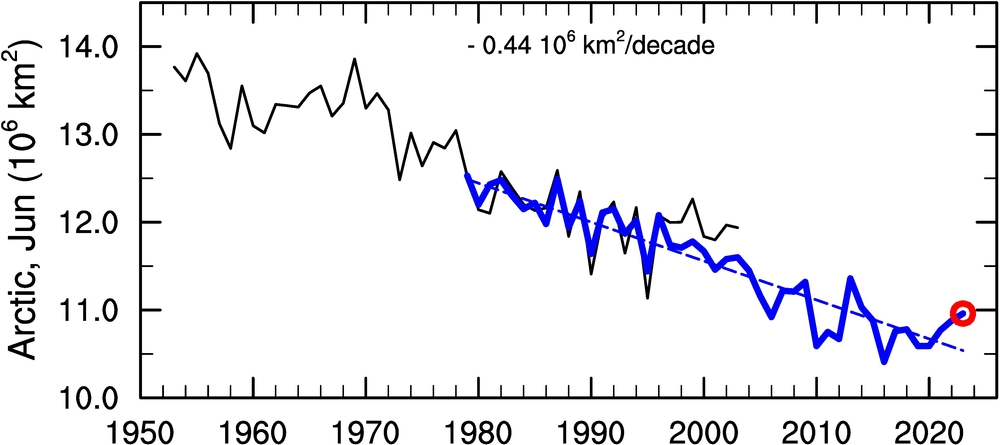
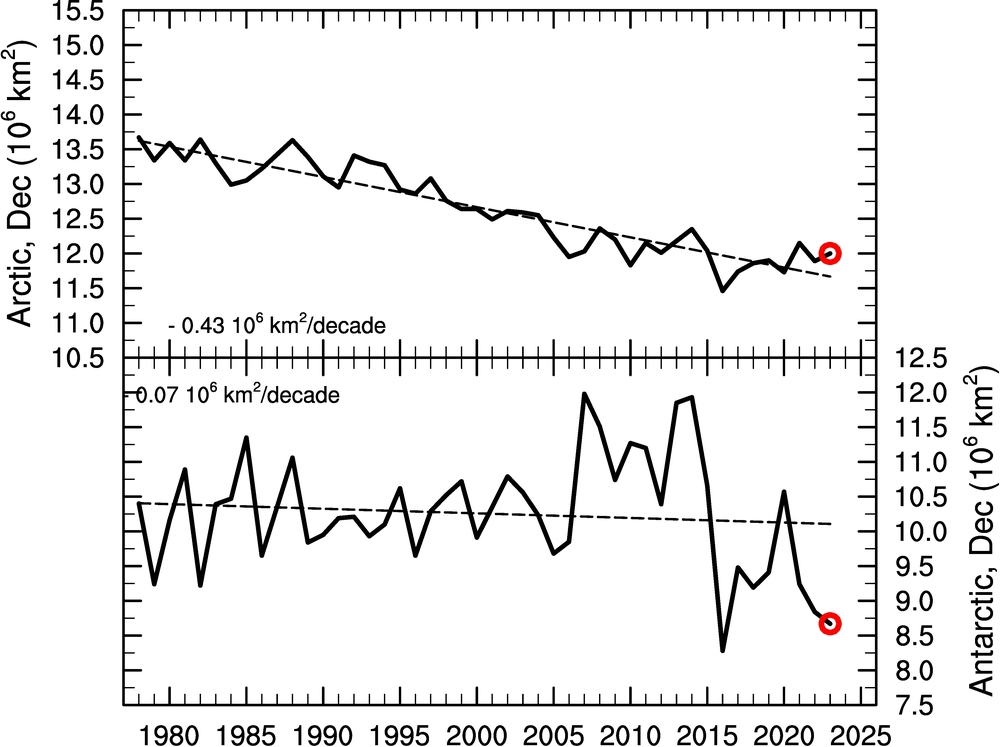
Monthly sea ice extent, Arctic and Antartctic

Observed, monthly mean Arctic (top) and Antarctic sea ice extent since November 1978 in 106 km2. Current year in red; the climatological mean for the 30-year period 1981-2010 in blue. Blue shading shows the vailability (expressed in terms of +/- 1 standard deviation for the period 1981-2010), whereas maximum and minimum values for the time series are shown with black lines.


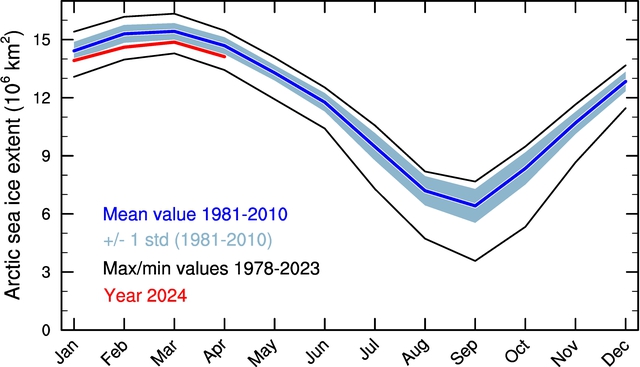
Satellite data from National Snow and Ice data Center. Note: Errors may occur since all figures are automatically updated with only sporadic checking.
Return to Sea ice overview. Return to top of page.

Minimum sea ice extent, Northern and Southern Hemisphere

Top panel: Satellite observed change in Northern and Southern Hemisphere sea ice cover for the summer months September and March, respectively, since 1979 (in 106 km2). Last data point is marked with a red circle. Mean decadal trends for the full time series are given. Bottom panel: As above, but for the Northern Hemsiphere sea ice extent with the time series extending back to 1953 by means of the HadISST sea ice reconstruction (the two time series have the same mean value for the period 1979-1999).

Satellite data from 1979 (blue lines) from National Snow and Ice data Center and reconstructed sea ice from 1953 (black line) from the UK Hadley Centre.
Note: Errors may occur since all figures are automatically updated with only sporadic checking.
Return to Sea ice overview. Return to top of page.

Maximum sea ice extent, Northern and Southern Hemisphere

Top panel: Satellite observed change in Northern and Southern Hemisphere sea ice cover for the winter months March and September, respectively, since 1979 (in 106 km2). Last data point is marked with a red circle. Mean decadal trends for the full time series are given. Bottom panel: As above, but for the Northern Hemsiphere sea ice extent for March with the time series extending back to 1953 by means of the HadISST sea ice reconstruction (the two time series have the same mean value for the period 1979-1999).

Satellit data from 1979 (blue lines) from National Snow and Ice data Center and reconstructed sea ice from 1953 (black line) from the UK Hadley Centre.
Note: Errors may occur since all figures are automatically updated with only sporadic checking.
Return to Sea ice overview. Return to top of page.

Monthly sea ice extent, both hemispheres

Top panels: Satellite observed change in Northern and Southern Hemisphere monthly mean sea ice cover since November 1978 (in 106 km2). Last data point is marked with a red circle. Mean decadal trends for the full time series are given. Bottom panels: As above, but for the Northern Hemsiphere only and with the time series extending back to 1953 by means of the HadISST sea ice reconstruction (the two time series have the same mean value for the period 1979-1999).


January February
March April
May June
July August
September October
November December

Satellit data from 1979 (thick lines) from National Snow and Ice data Center and reconstructed sea ice from 1953 (thin lines) from the UK Hadley Centre.
Note: Errors may occur since all figures are automatically updated with only sporadic checking.
Return to Sea ice overview. Return to top of page.