
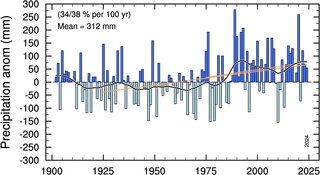
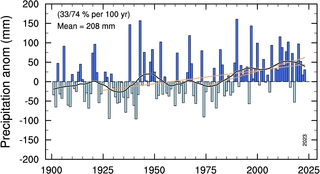
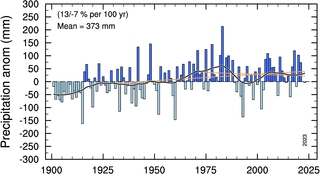
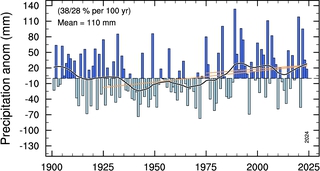
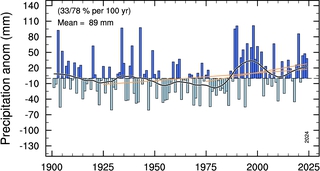
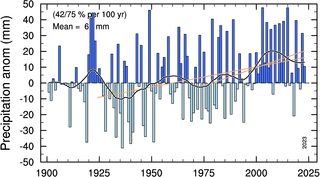
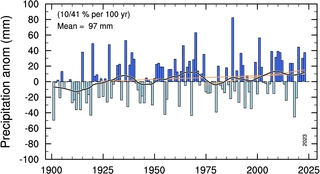
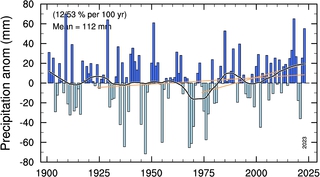
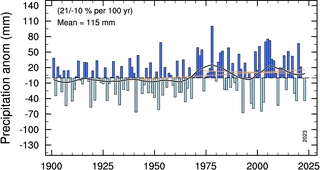
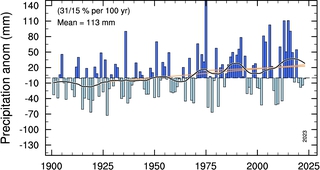
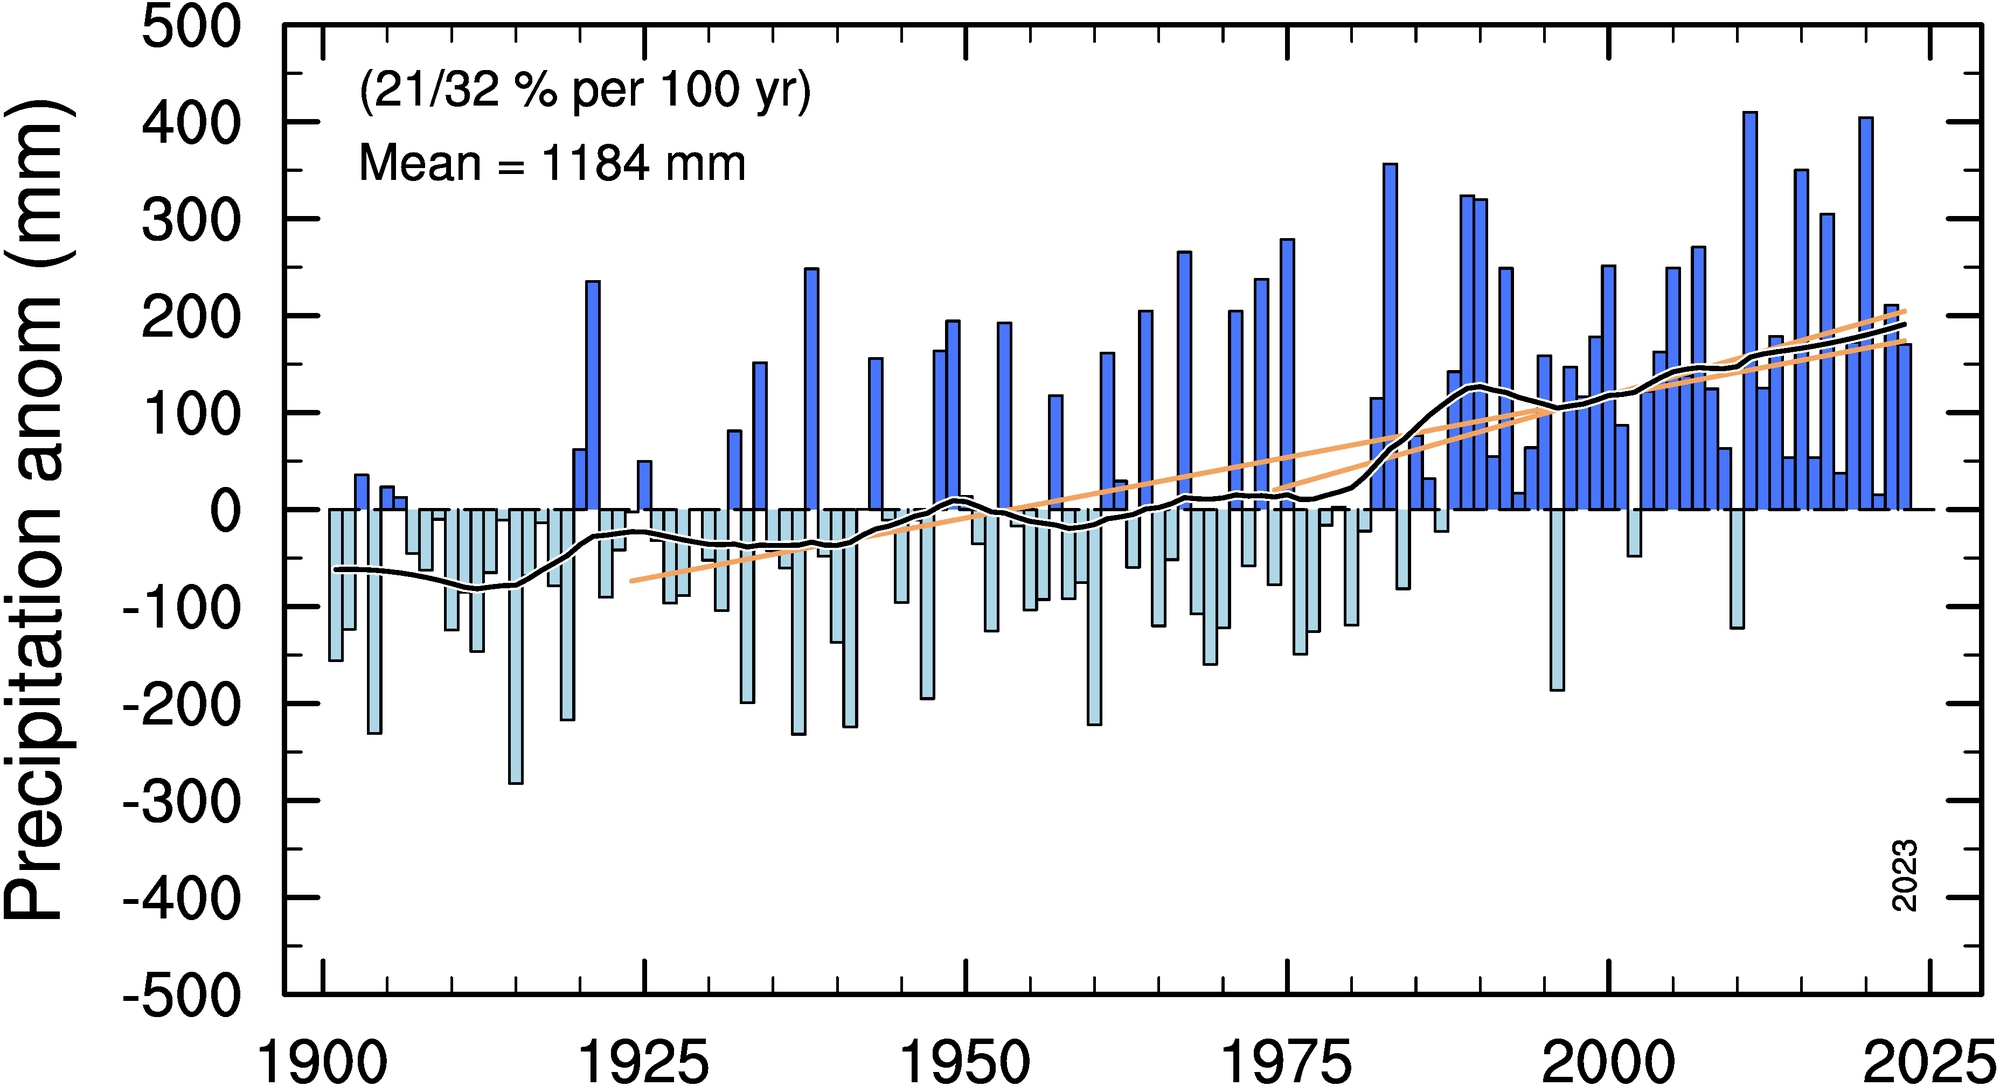
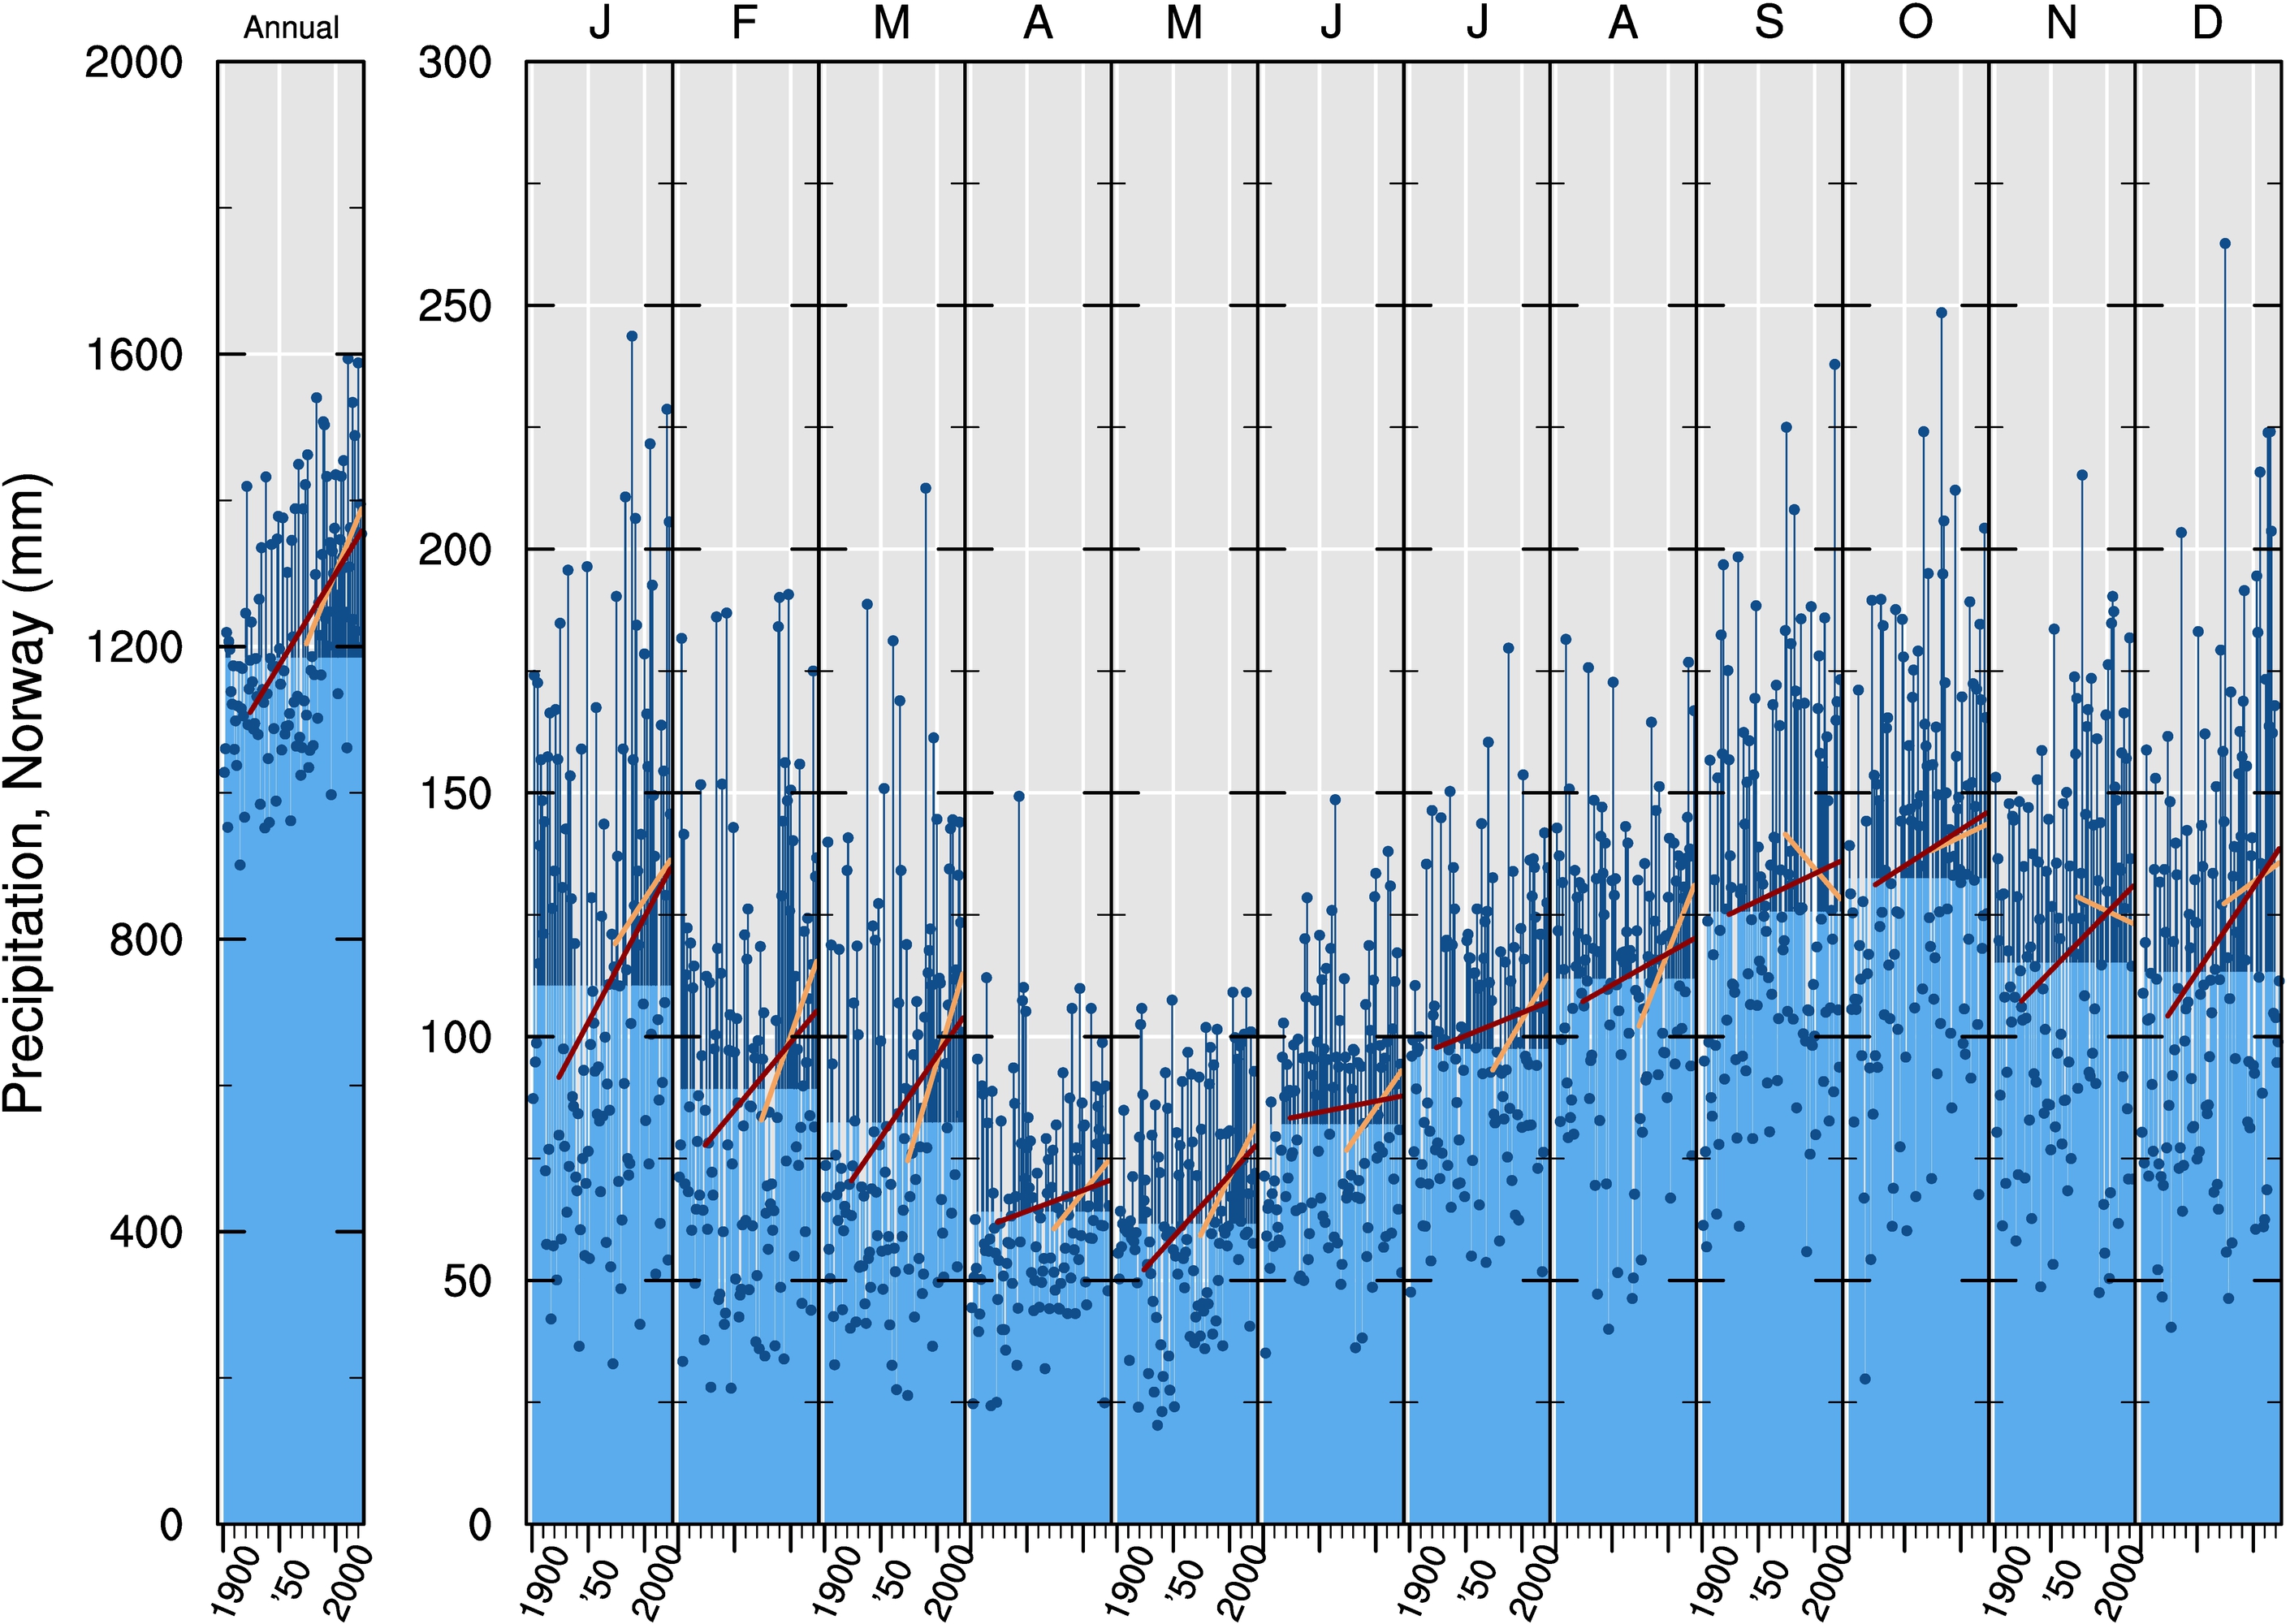
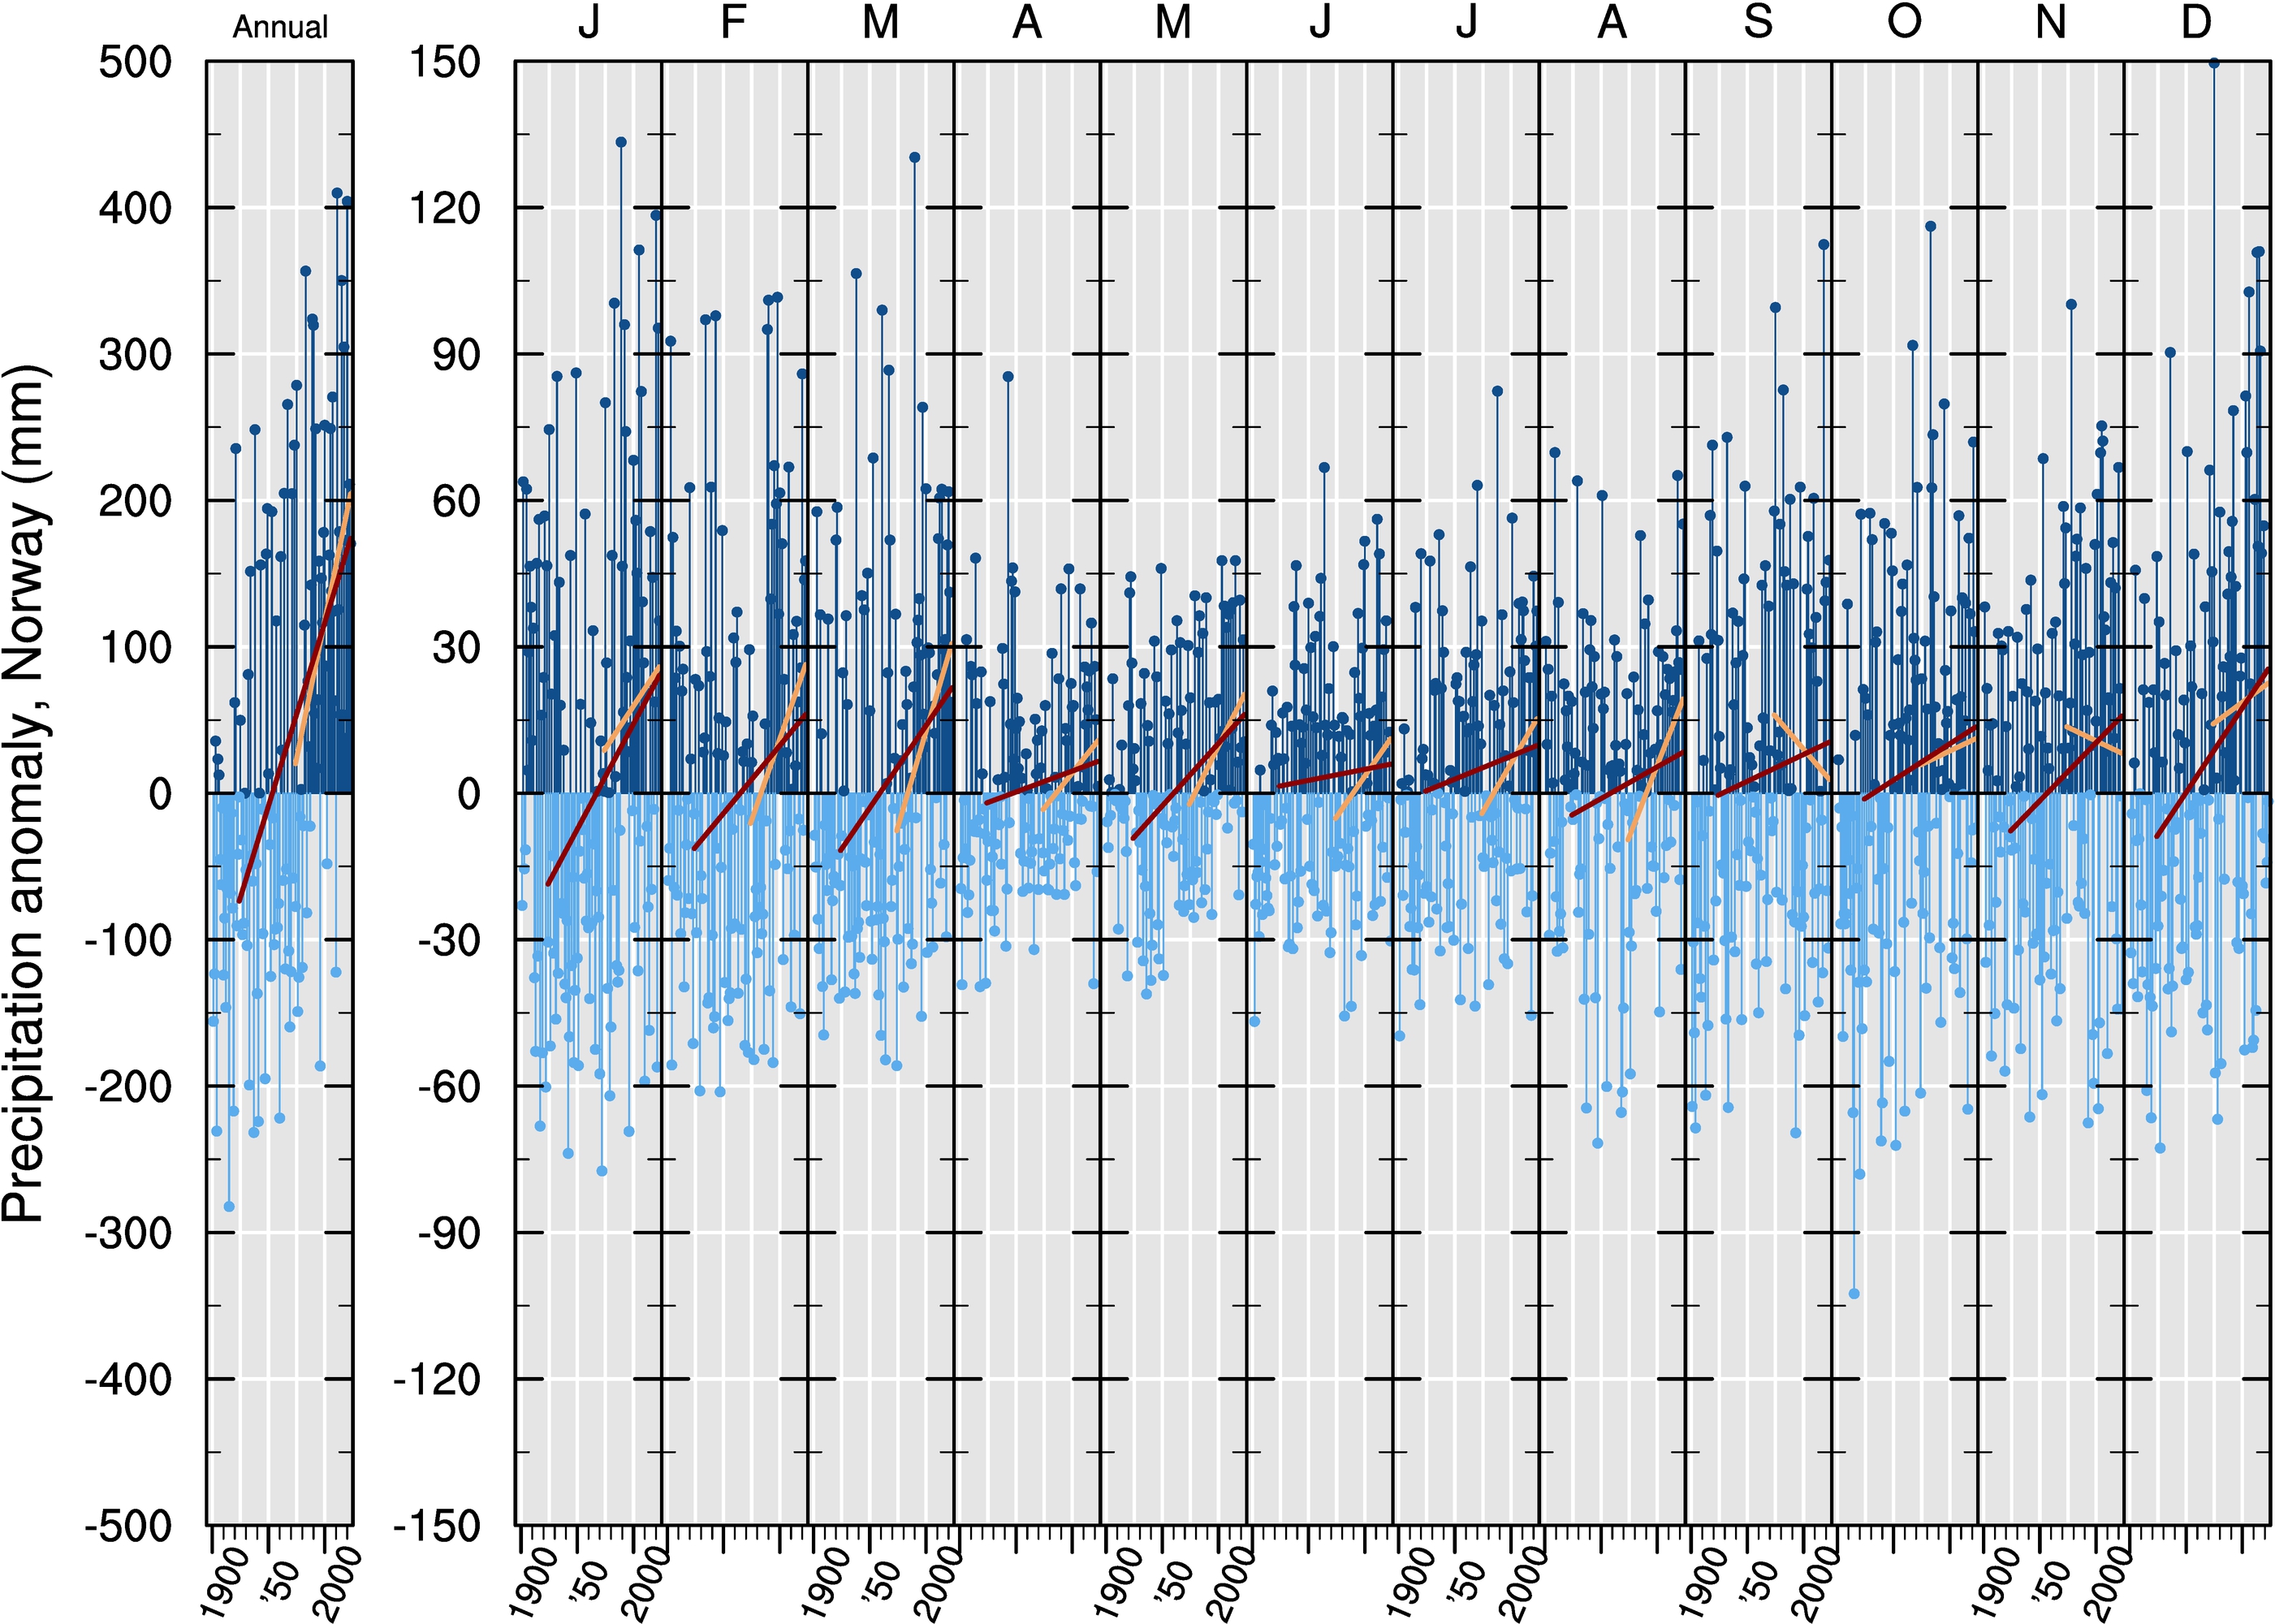
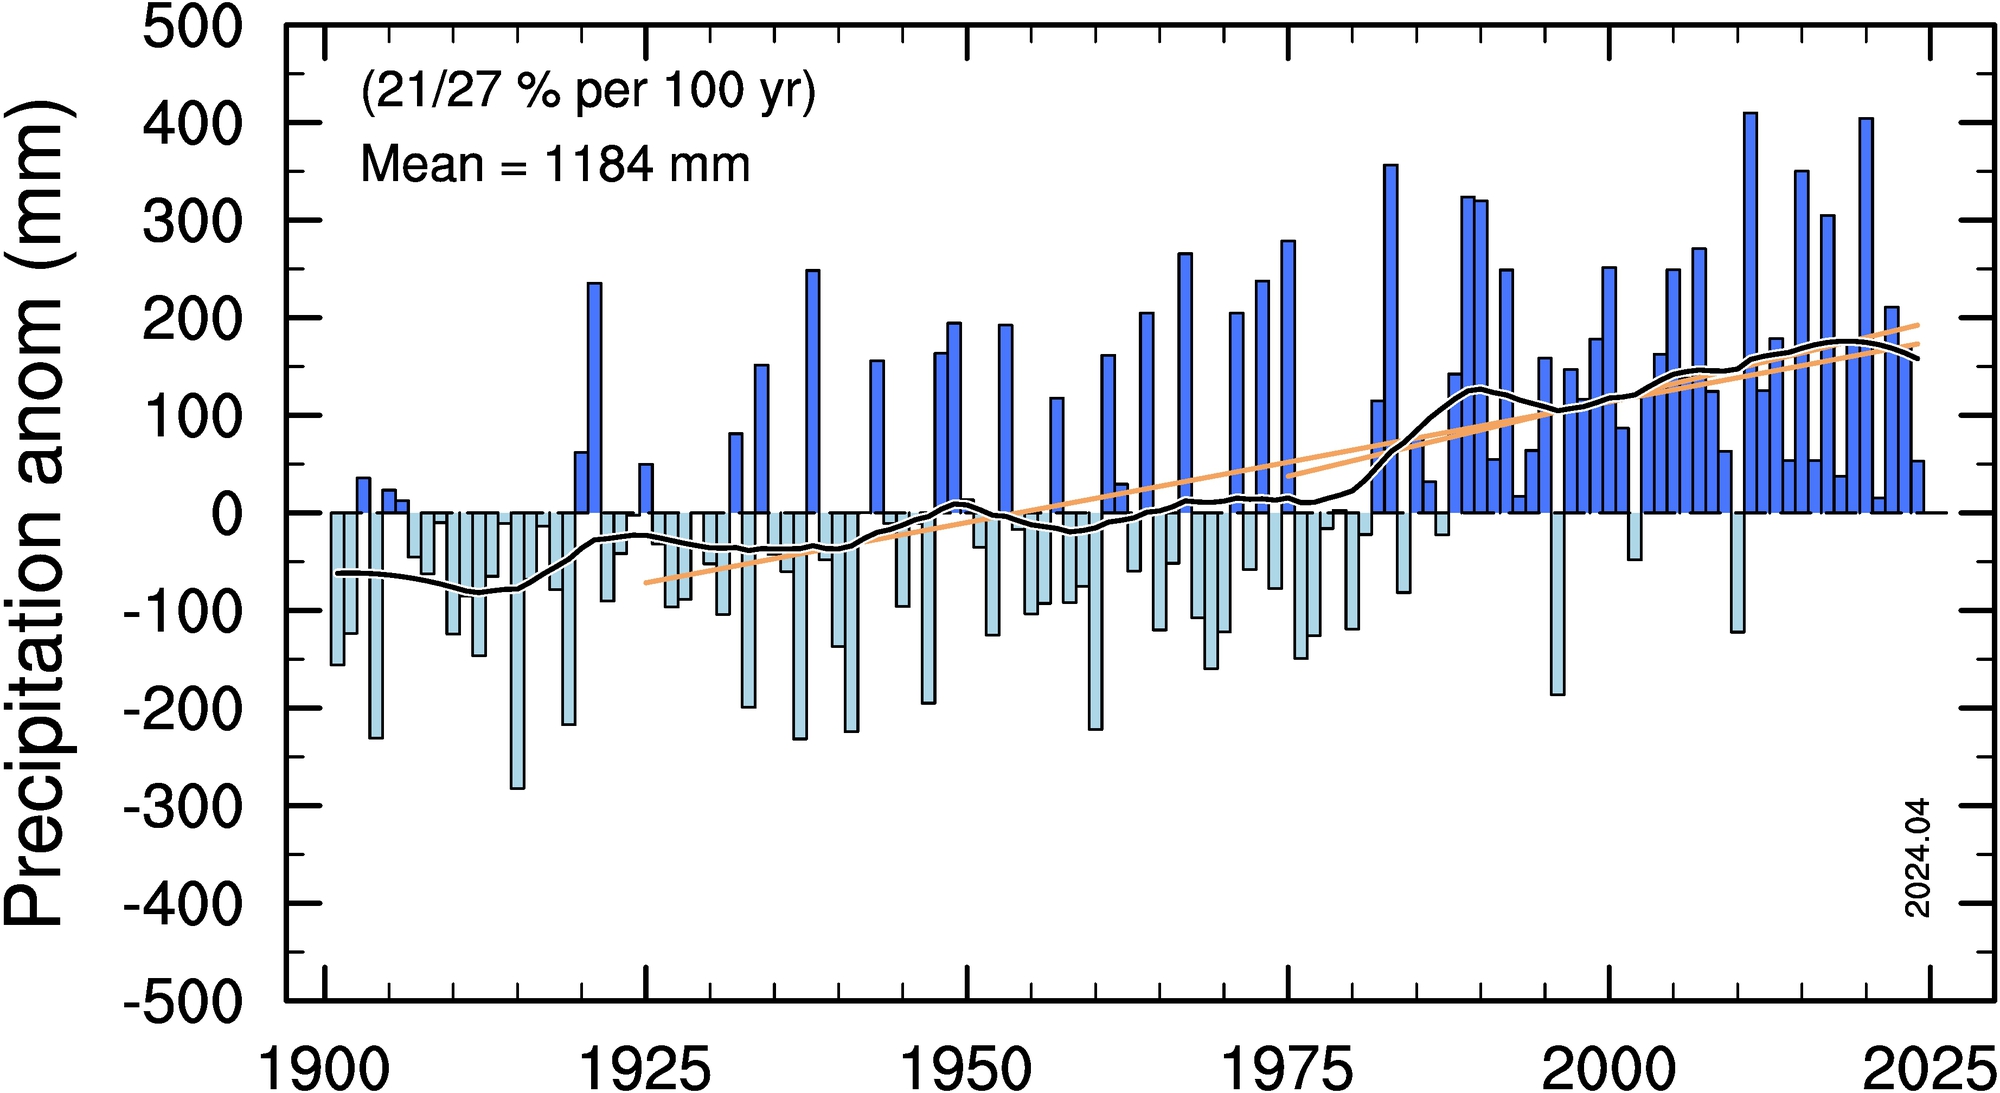
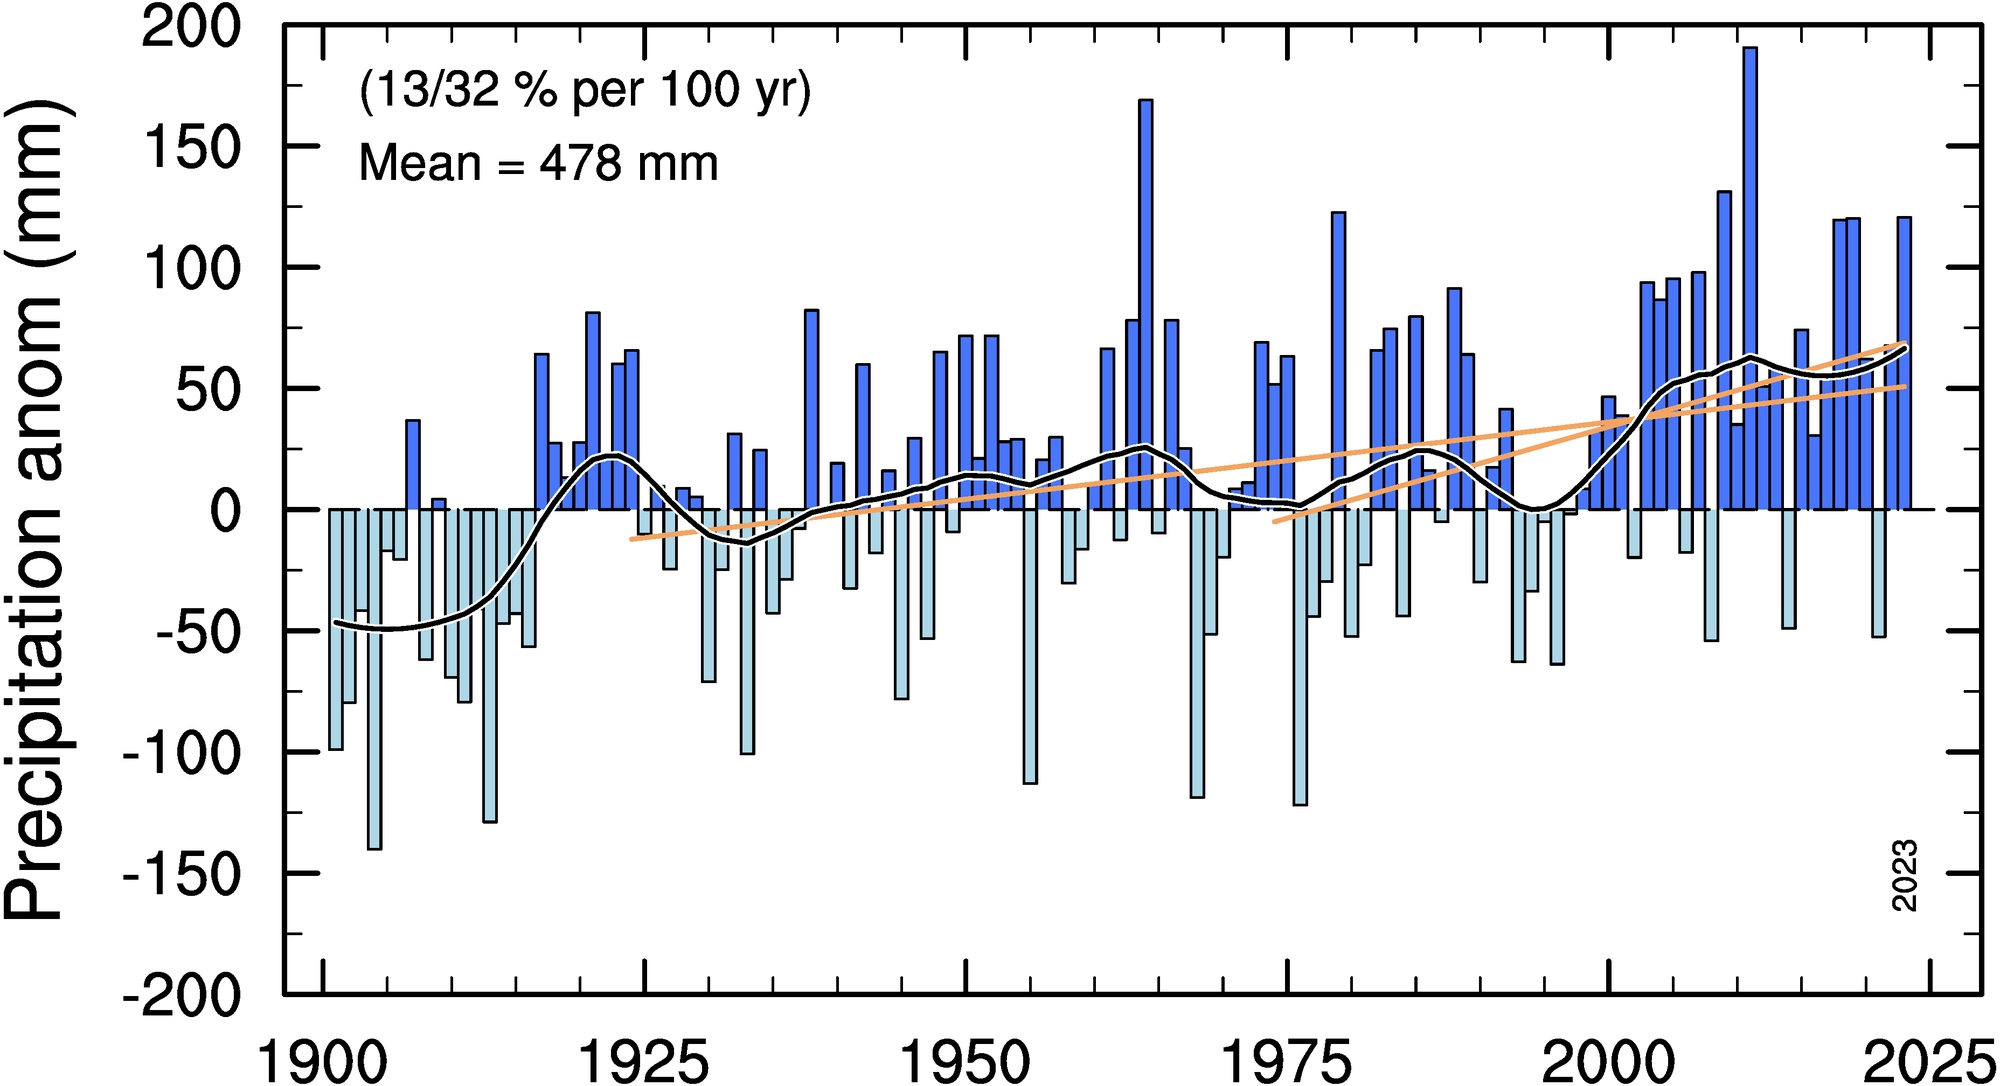
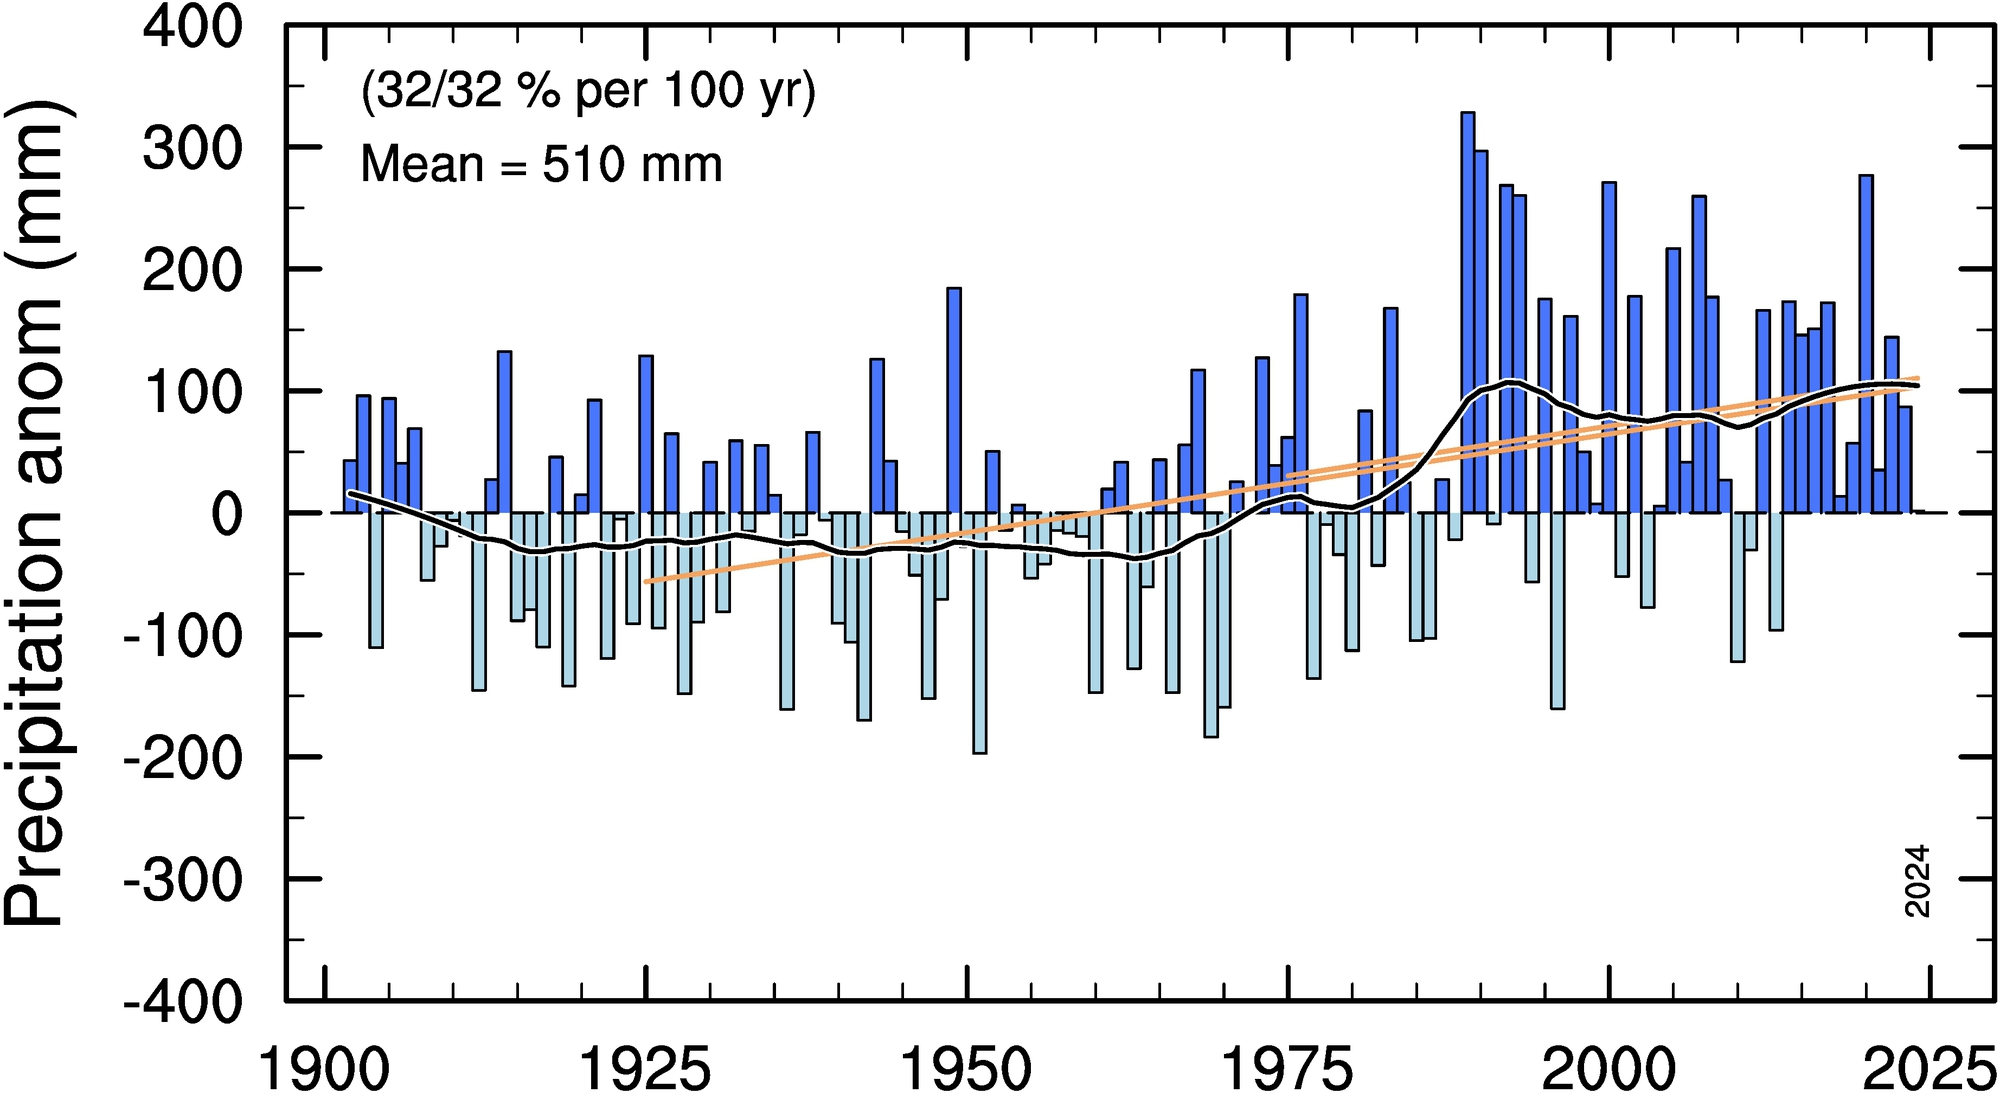
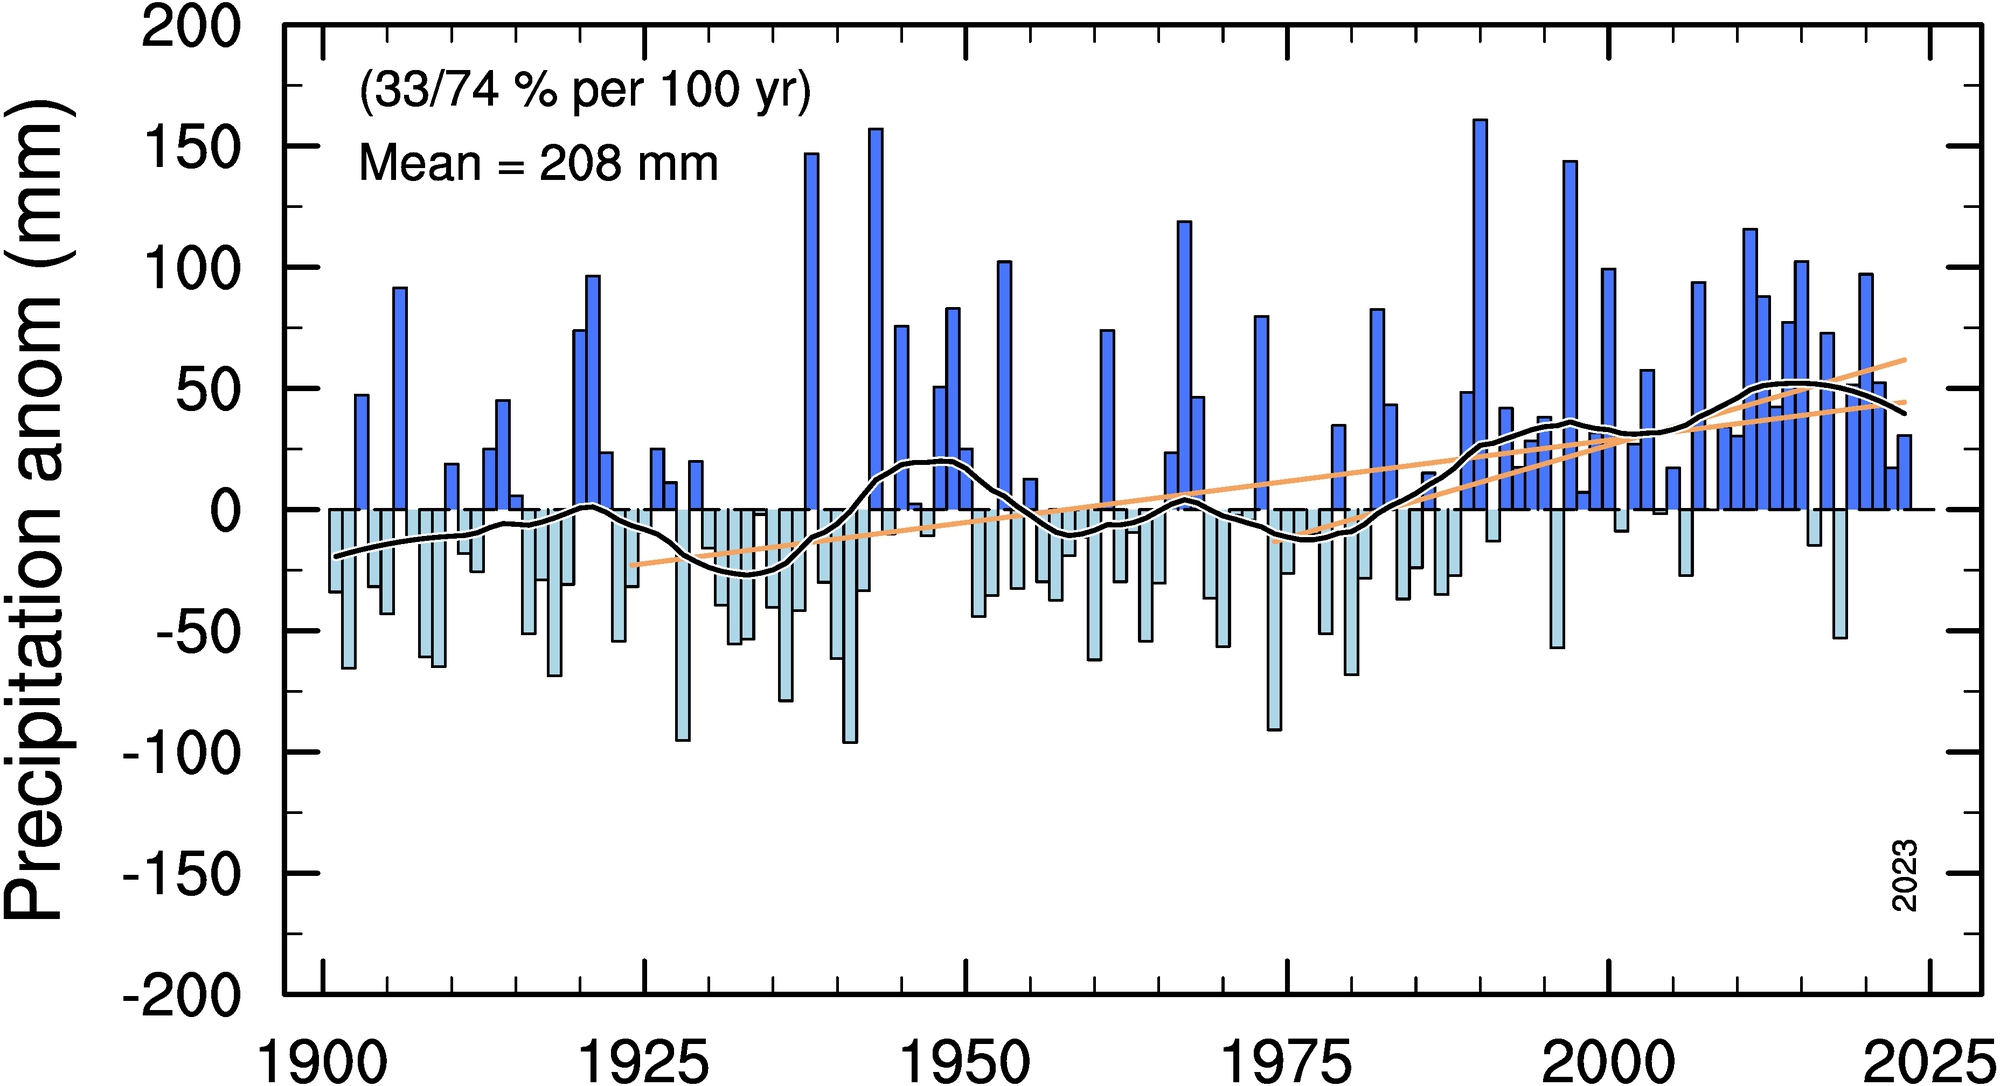
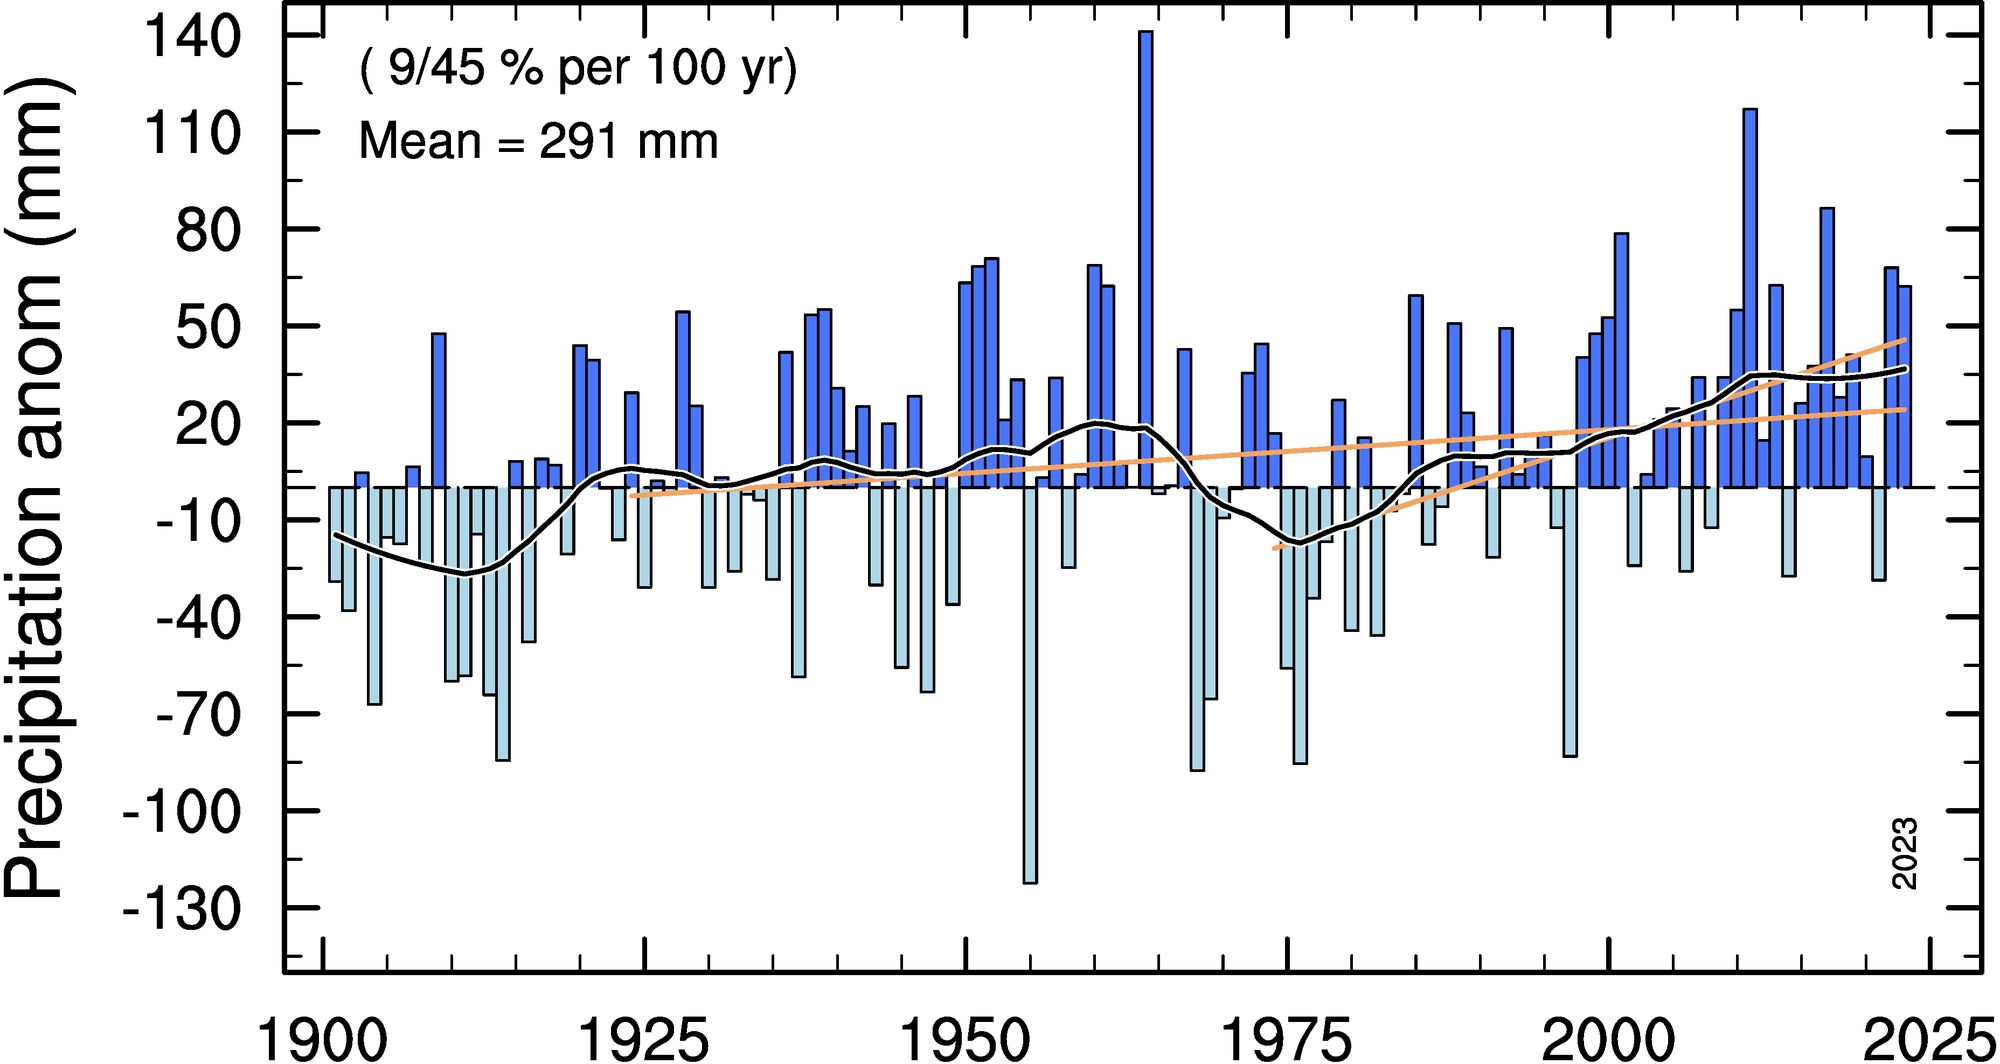
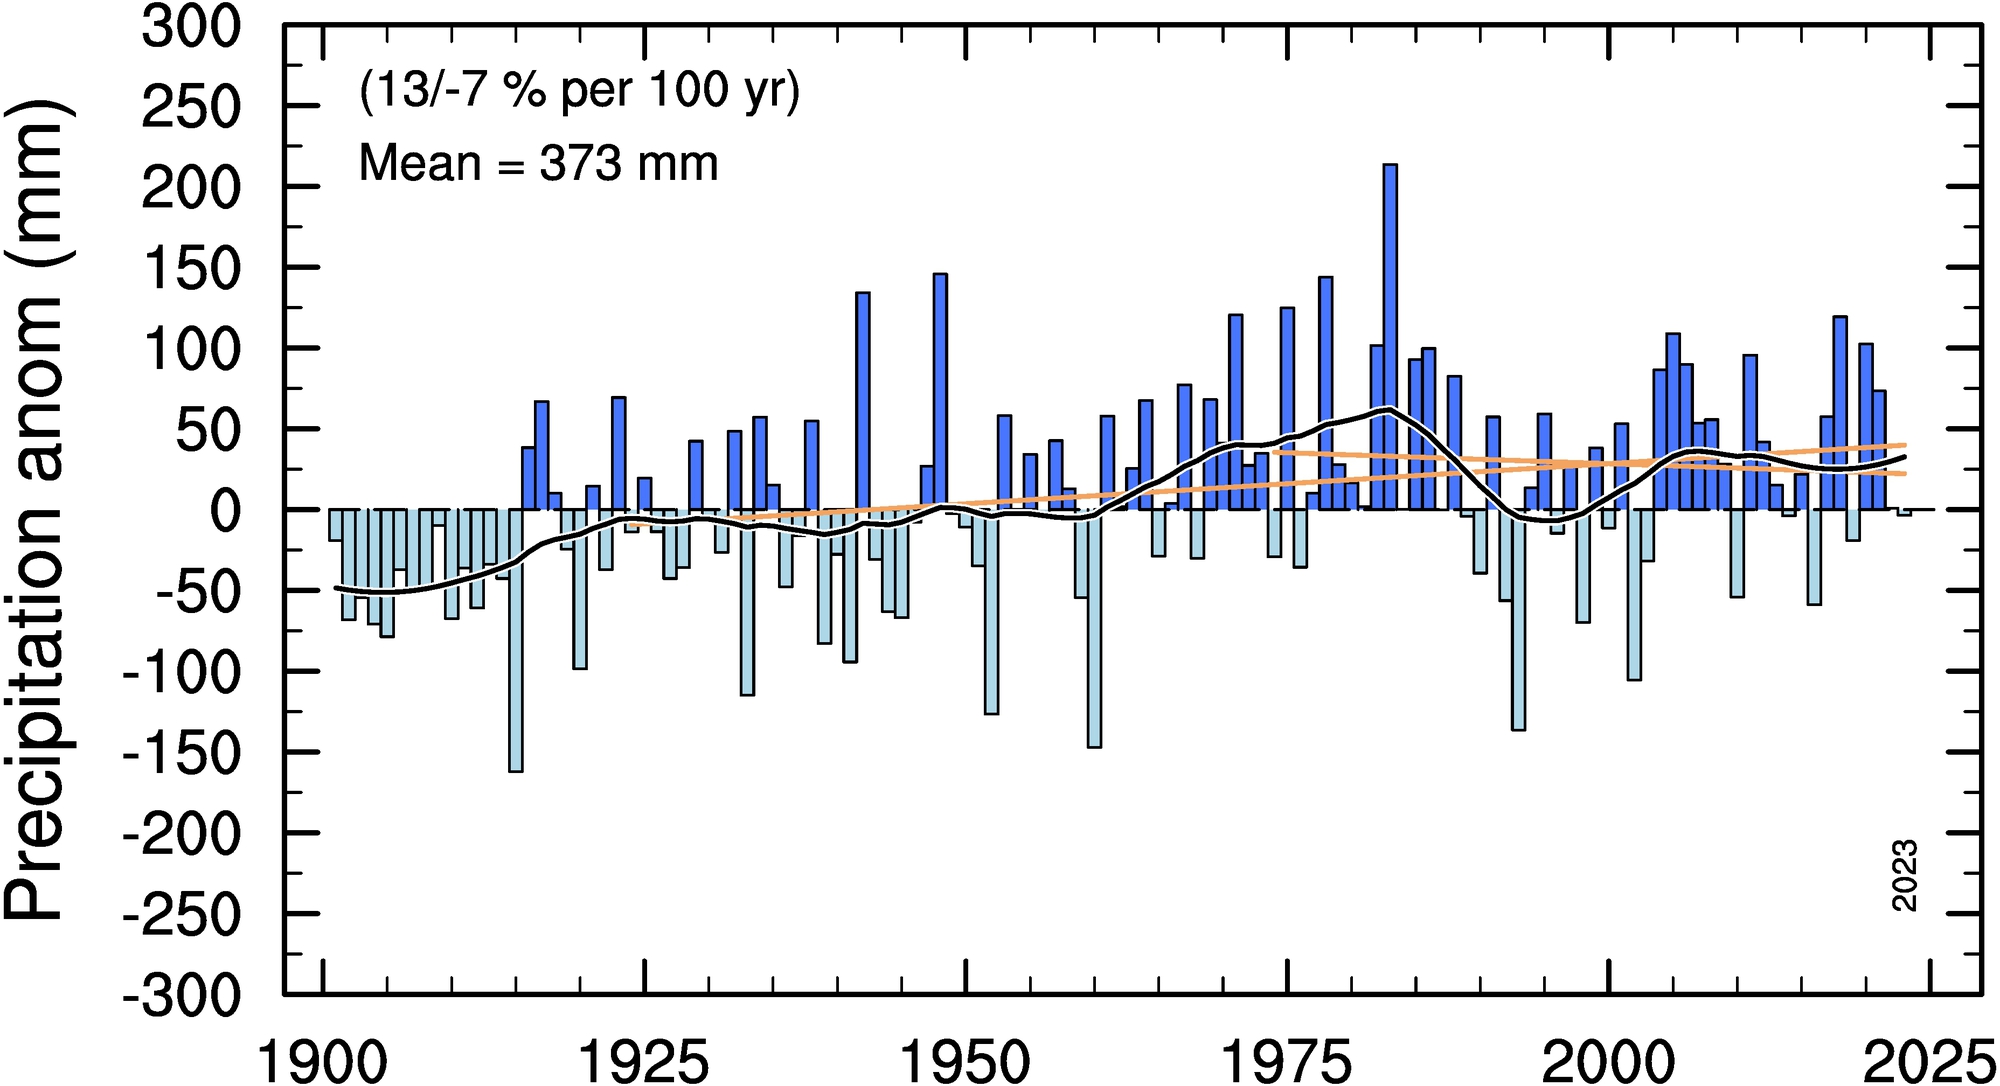
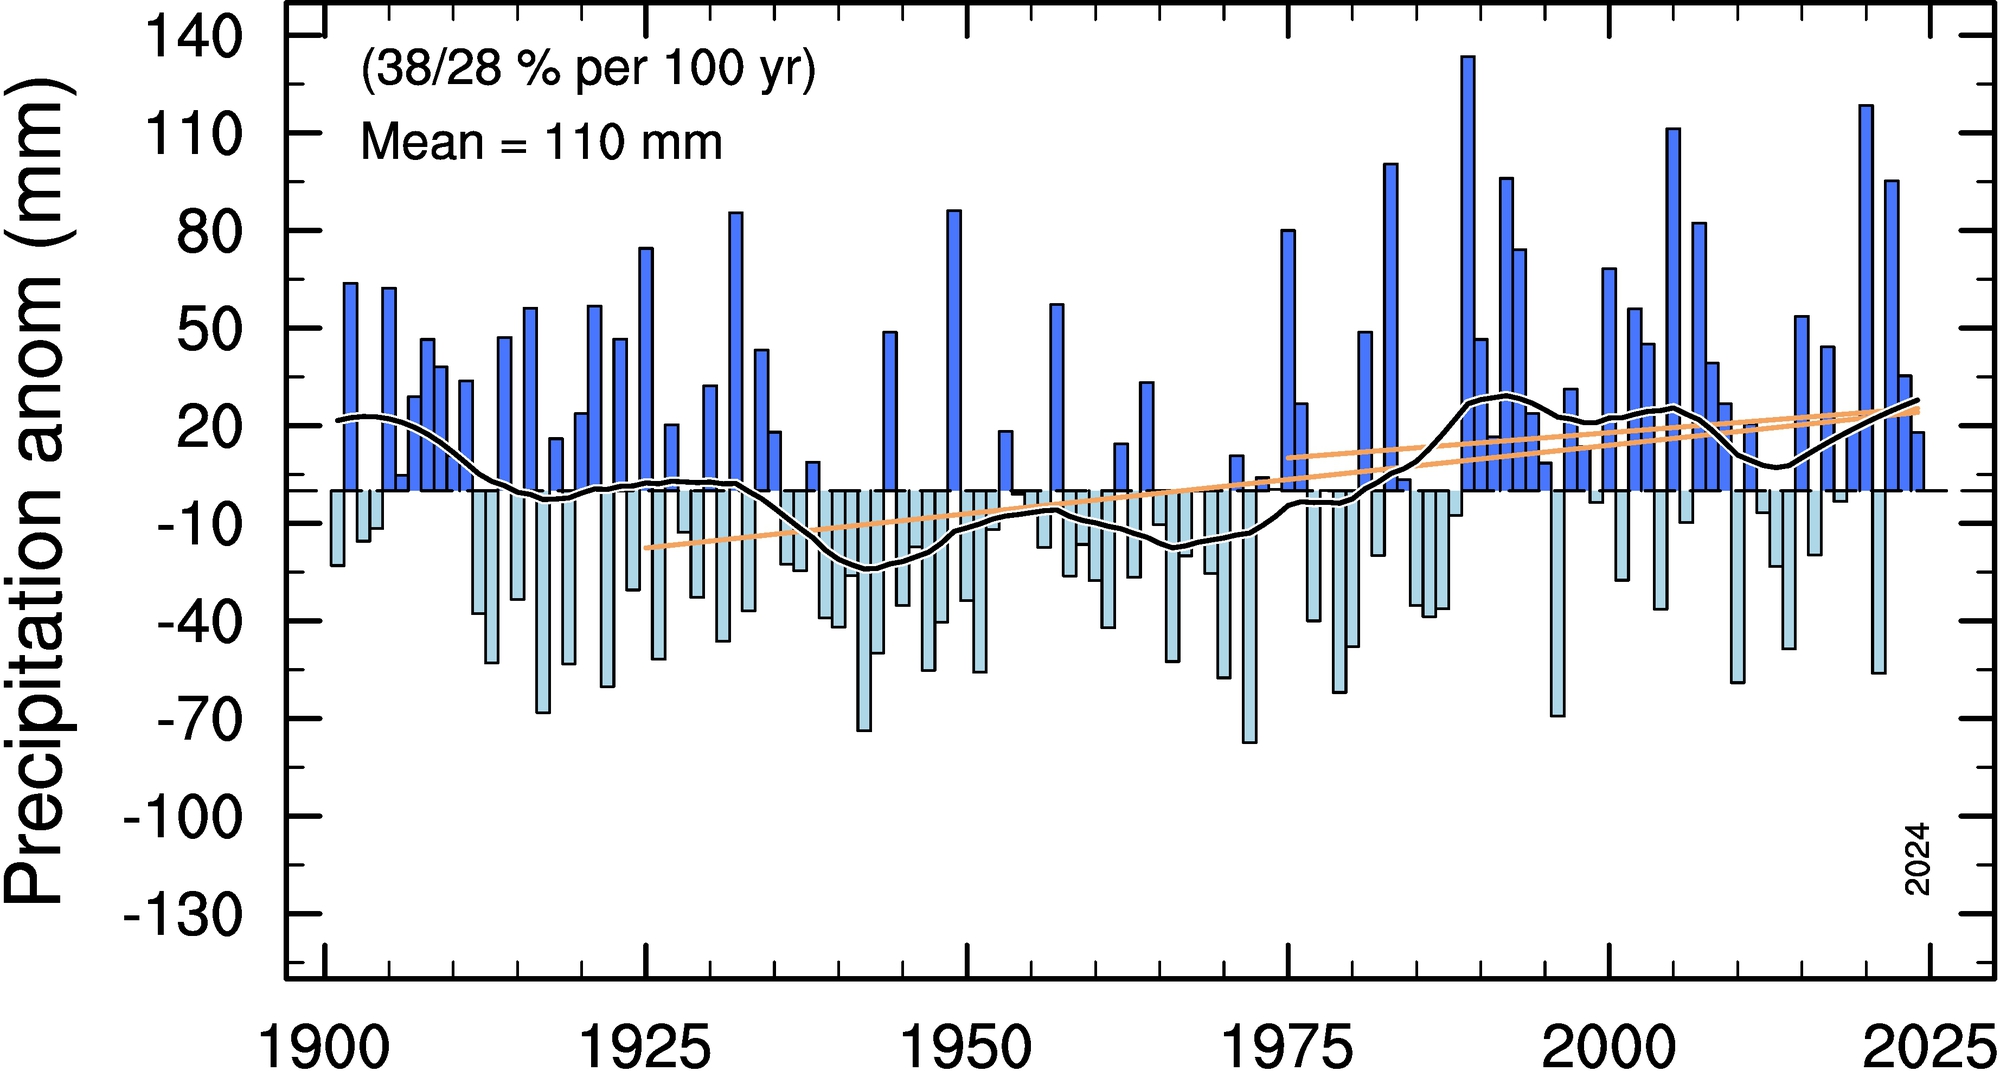
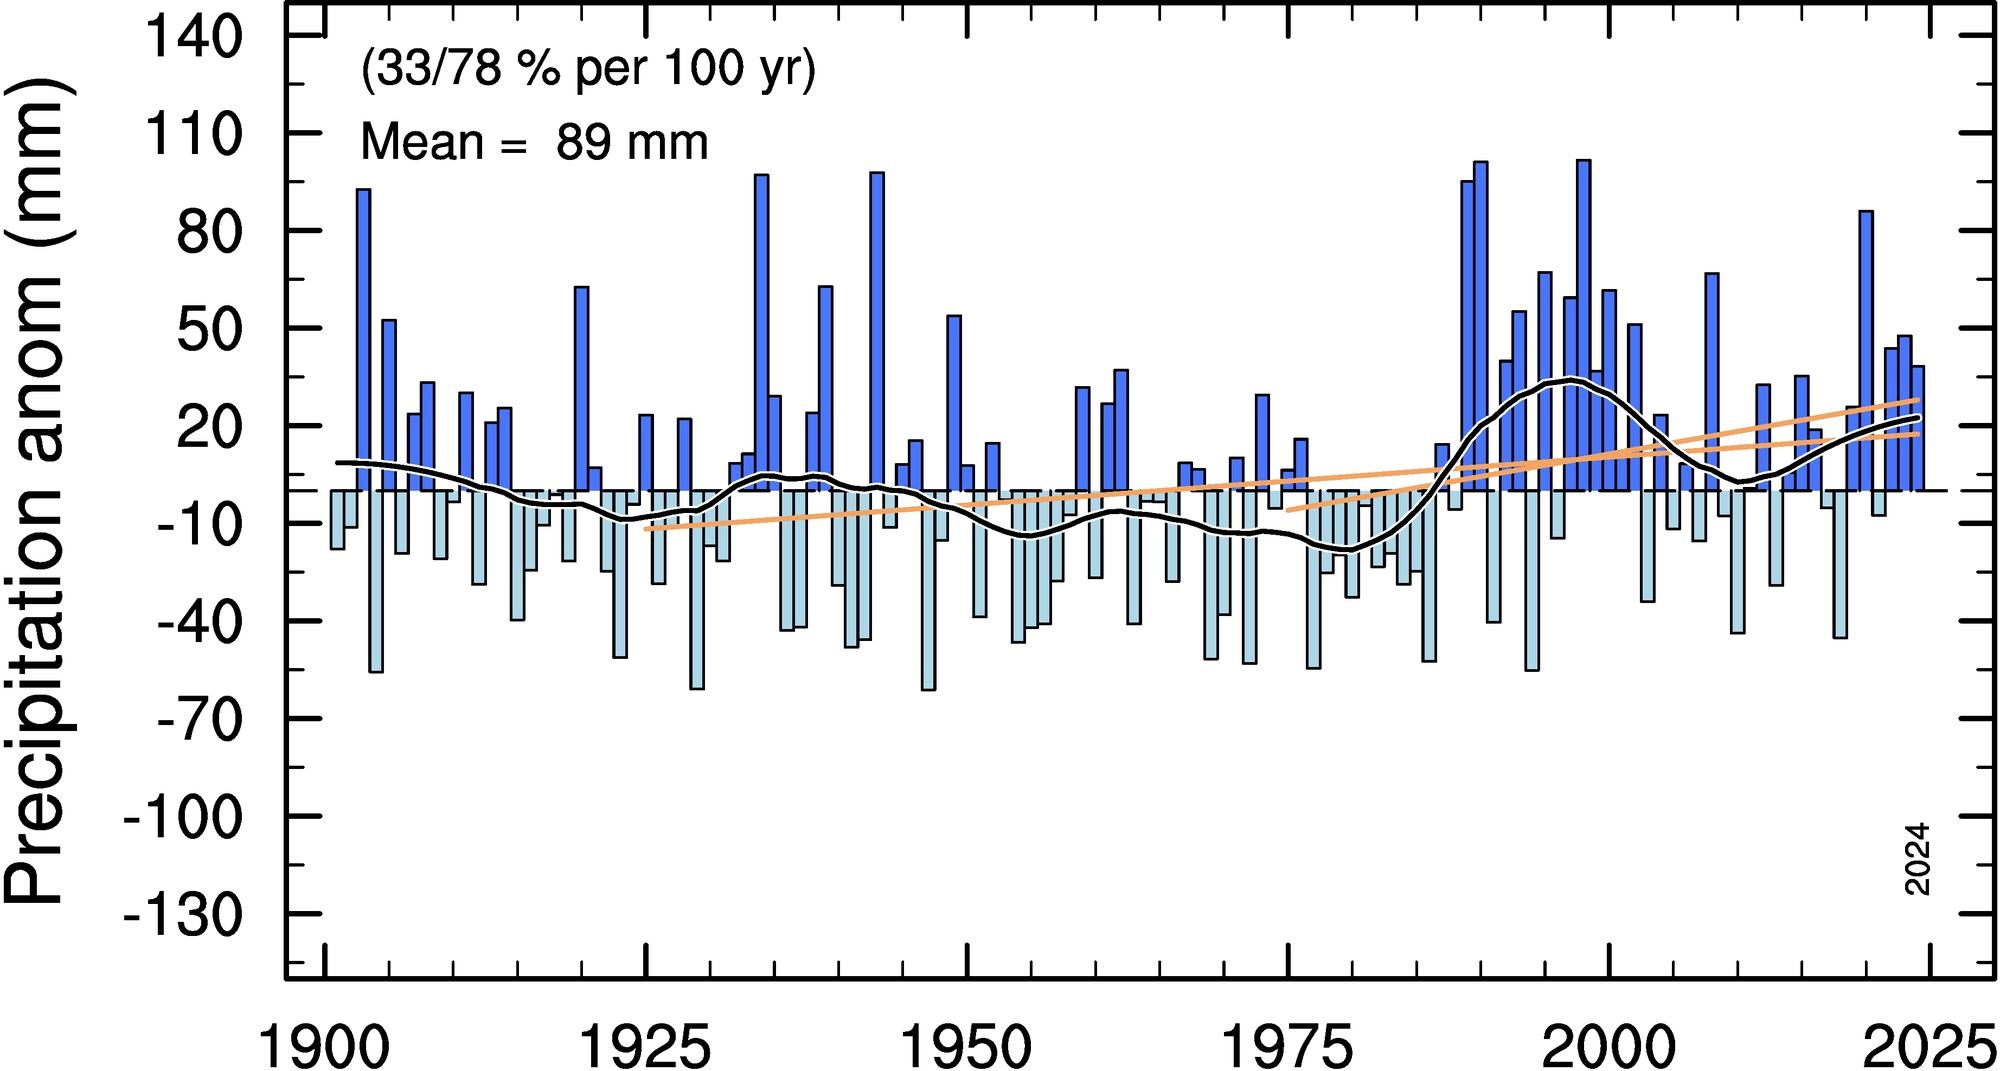
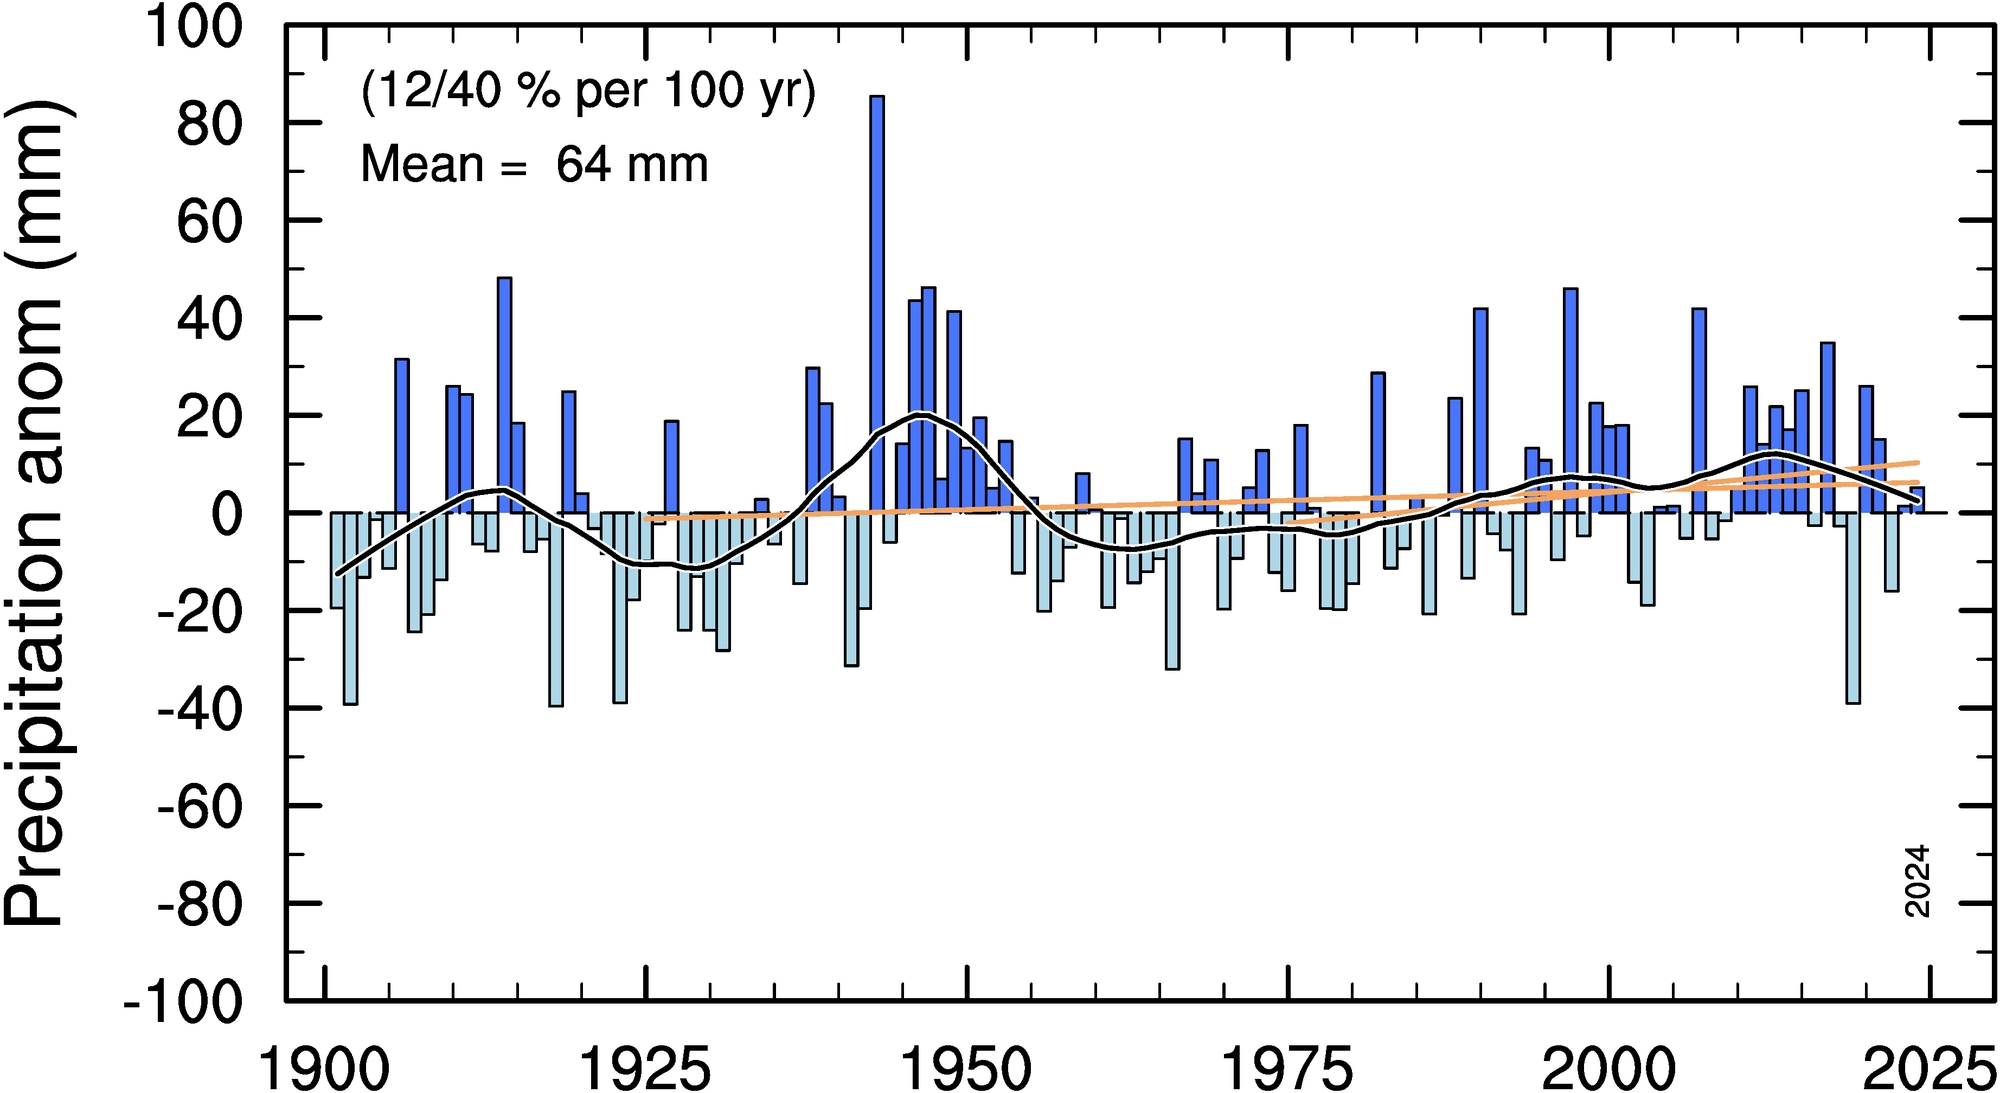
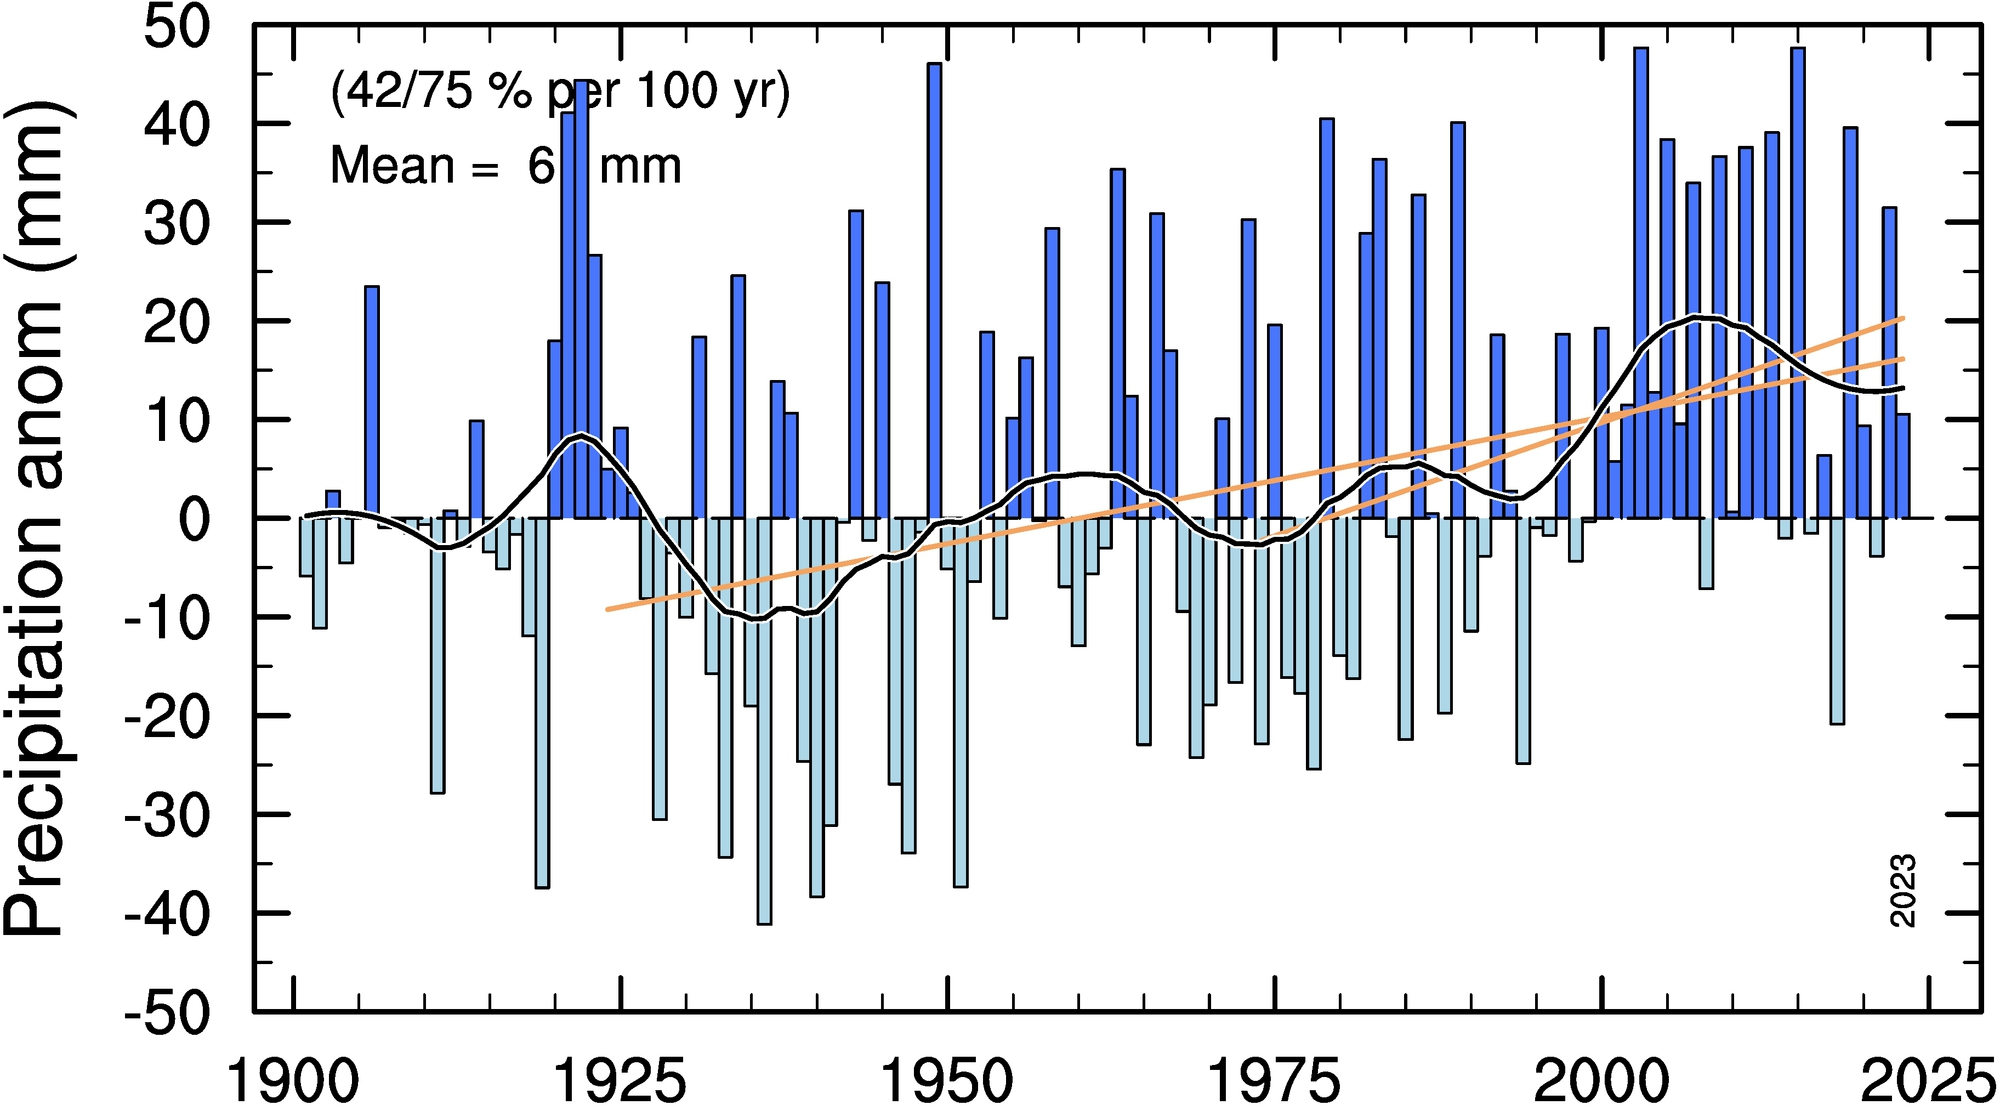
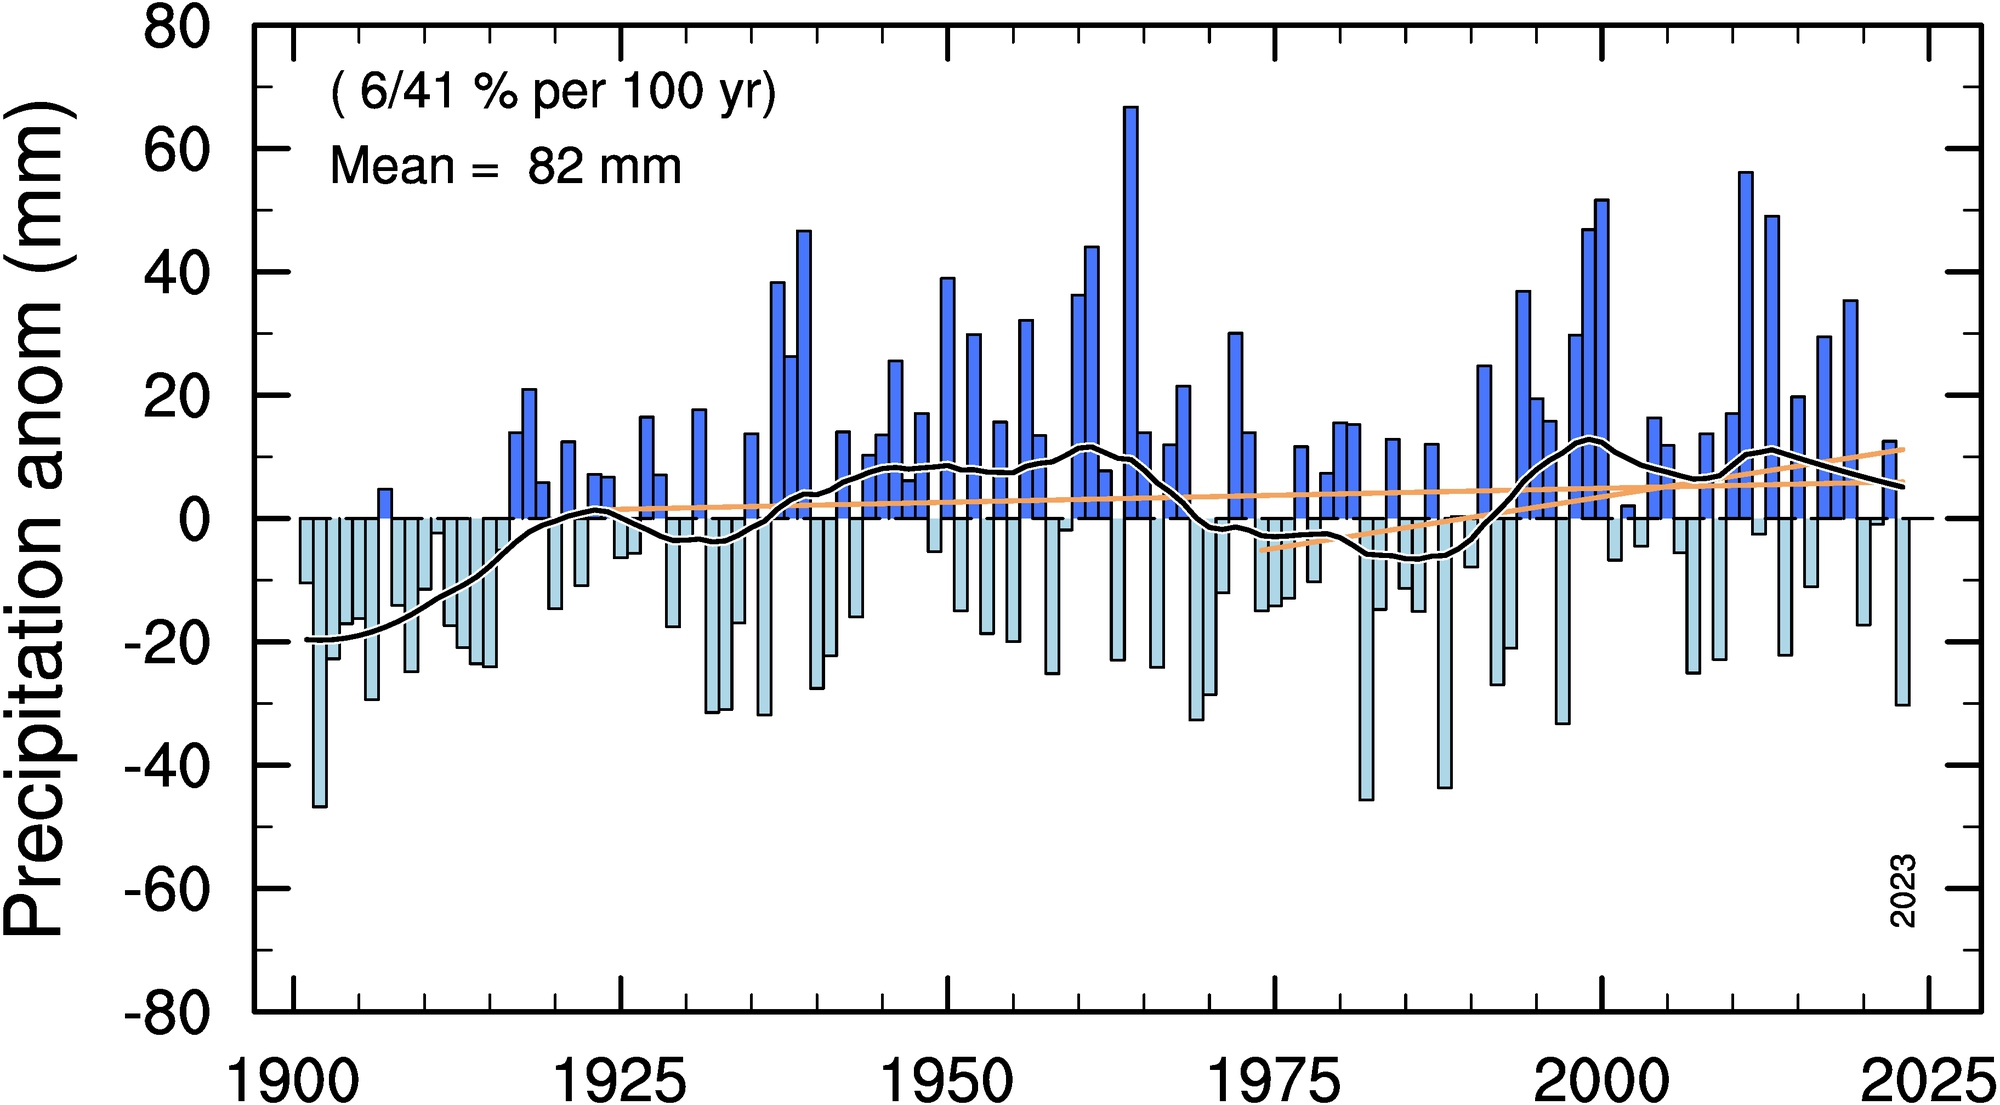
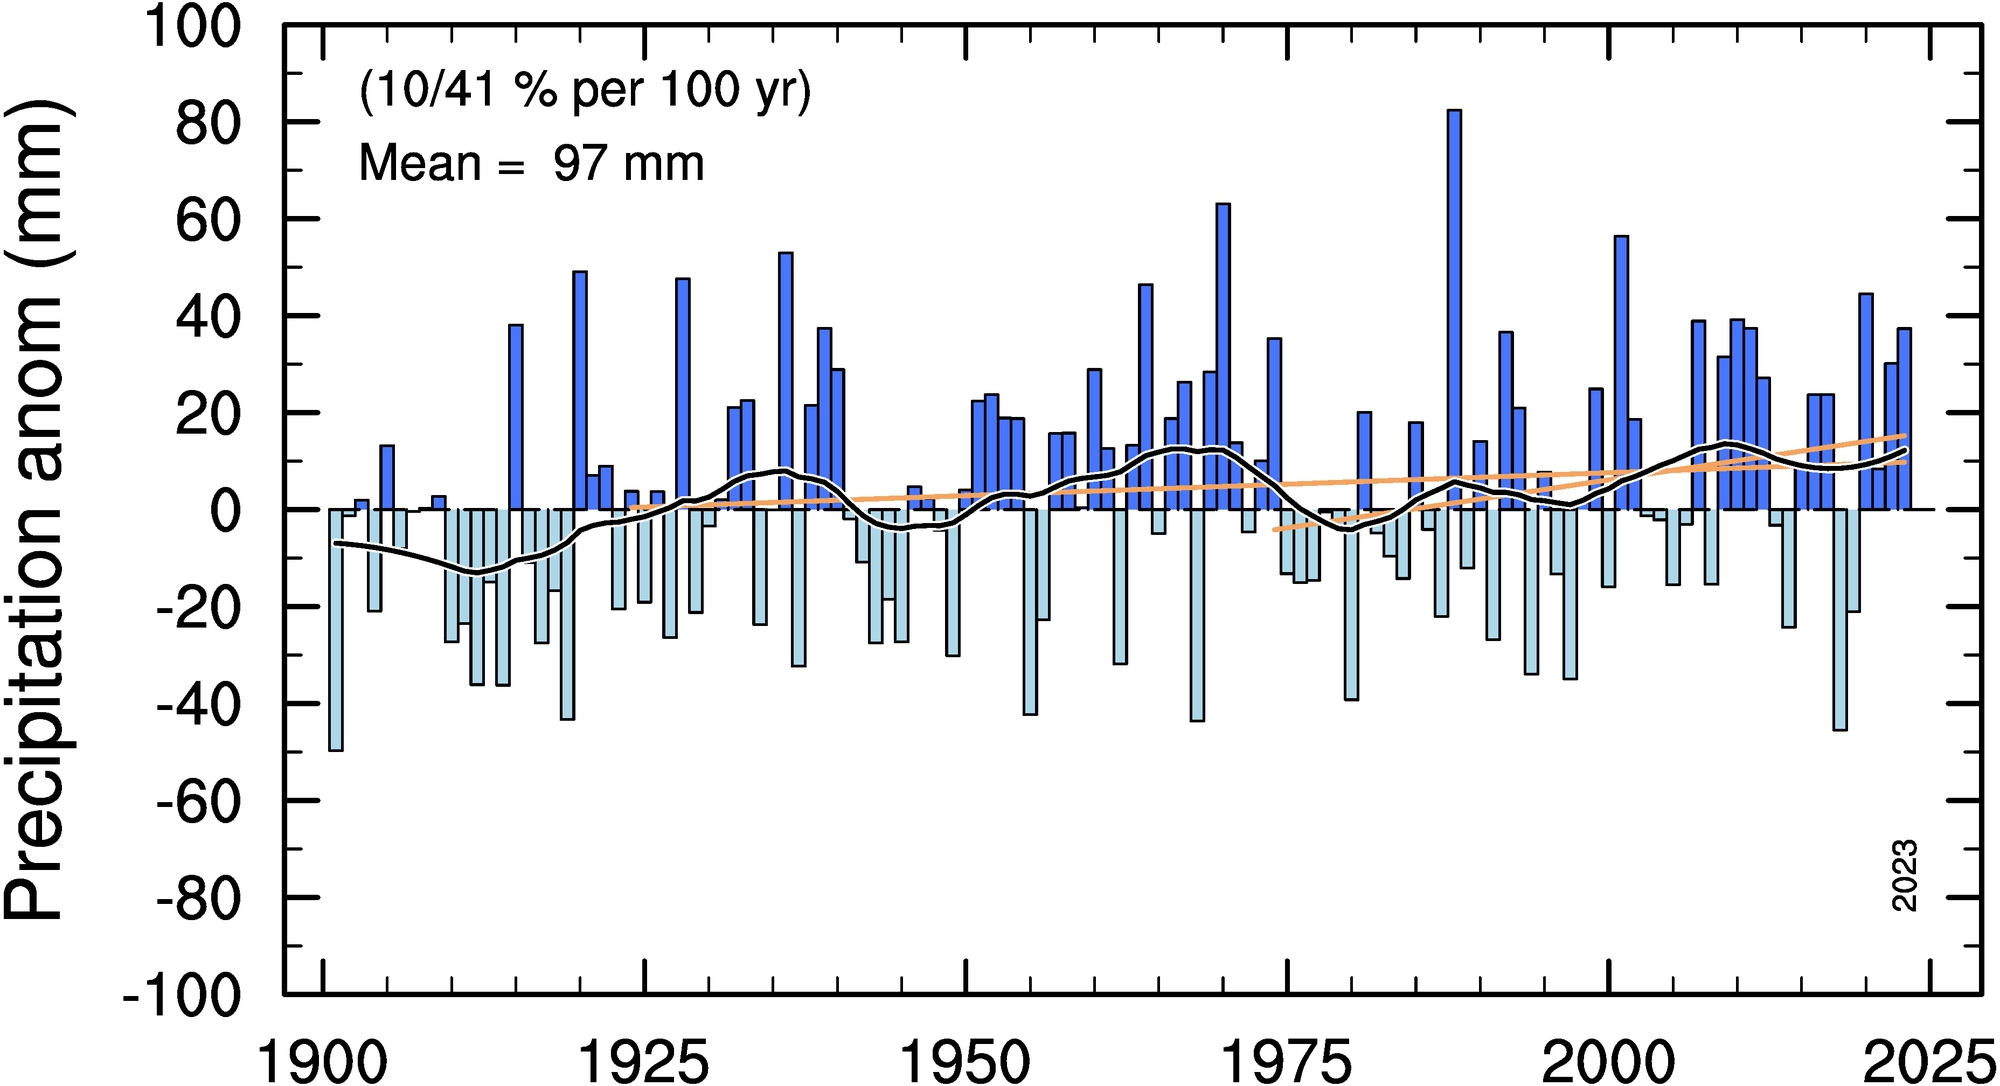
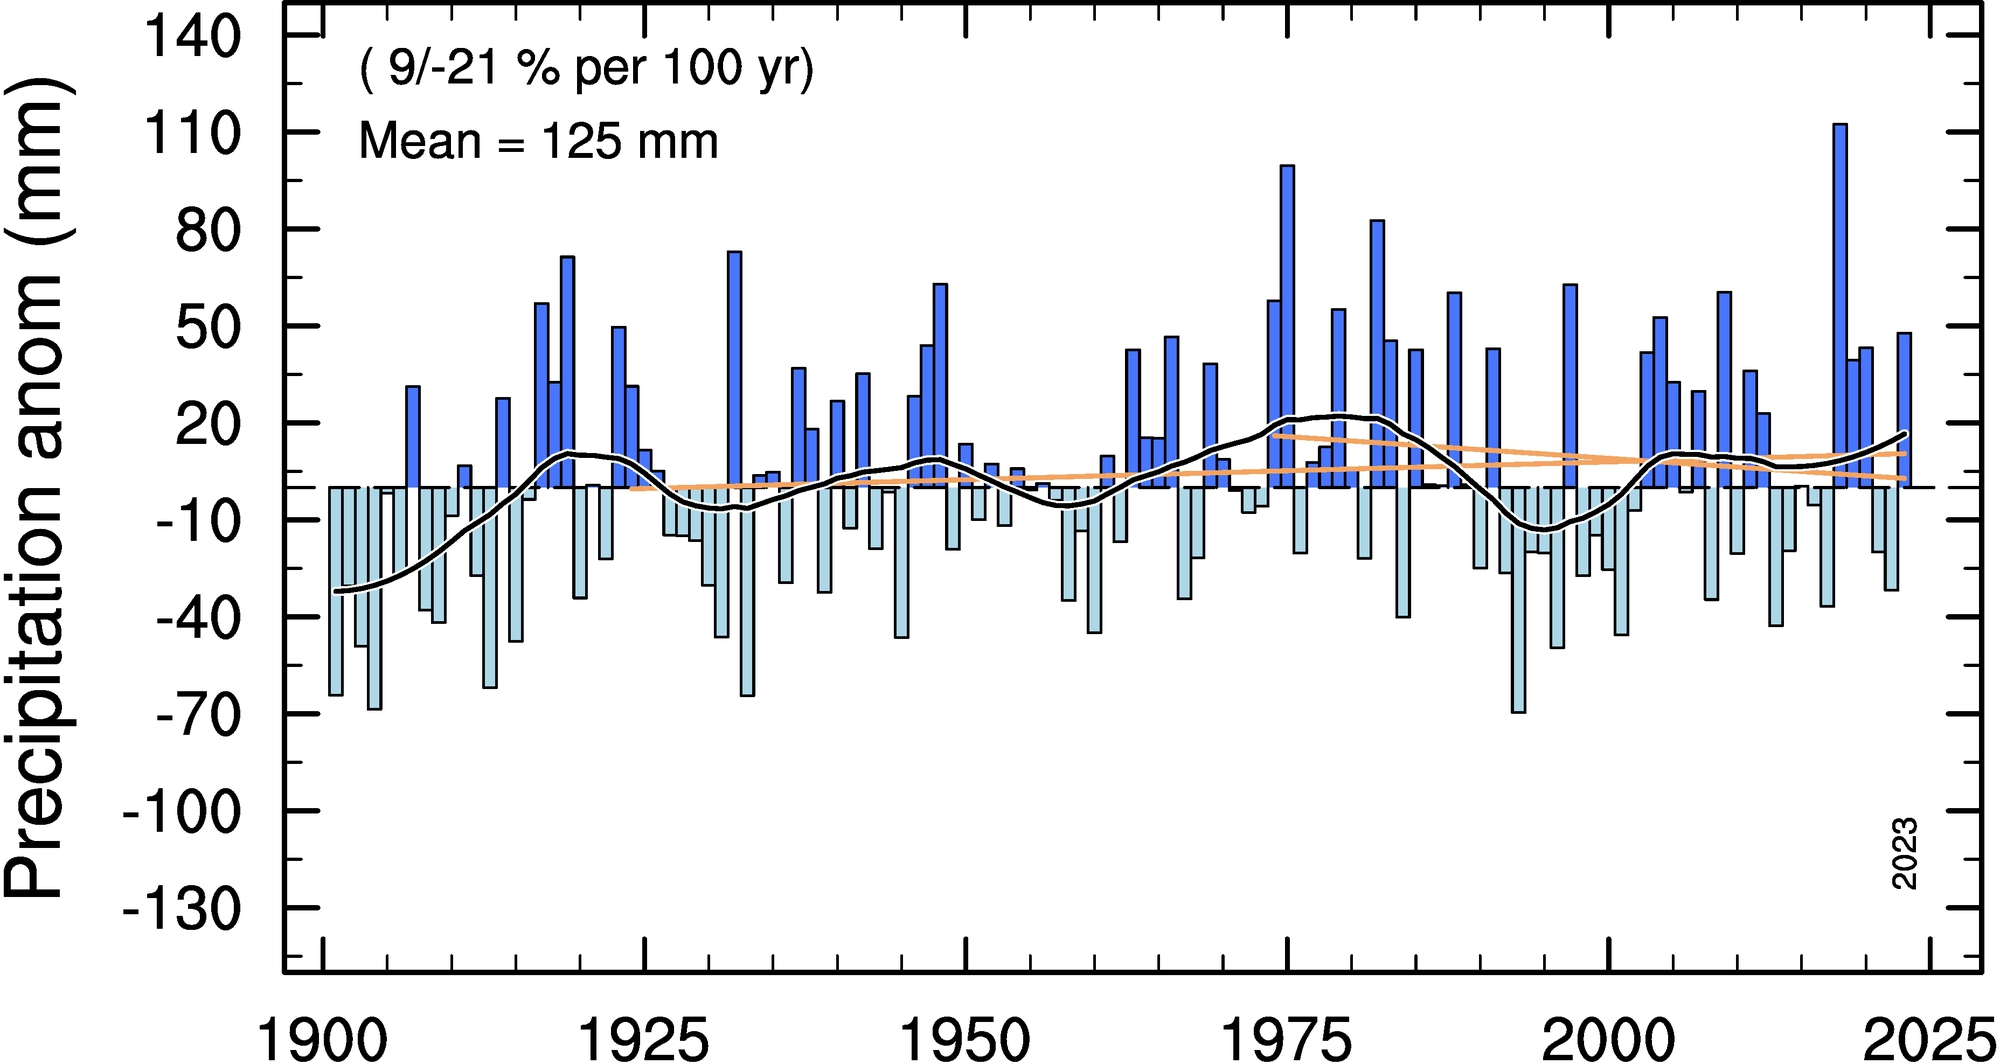
Annual mean precipitation, Norway
Observed change of annual mean precipitation for Norway since year 1900, relative to the 1901-2000 mean. The trend lines (grey colour) show the linear trends for the last 100 and 50 years. The string
(X/Y mm/decade)
gives the associated 100 year and 50 year linear slopes in millimeter per decade.
Mean = ...
gives the mean precipitation for the period 1901-2000 (the zero-line in the figure).
Last data point is given in the lower right corner of the figure.
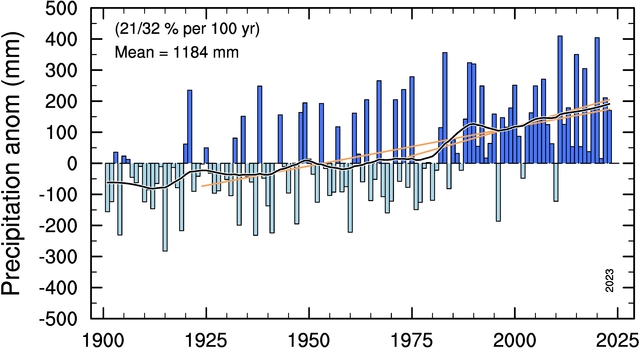
Data from eKlima of the Norwegian Meteorological Instutute.
Note: Errors may occur since all figures are automatically updated with only sporadic checking.
Return to Temperature overview. Return to top of page.
Note: Errors may occur since all figures are automatically updated with only sporadic checking.
Return to Temperature overview. Return to top of page.


