EuroVis (Eurographics / IEEE Symposium on Visualization) 2011
Europe’s top conference on visualization research, EuroVis 2011, has been held in Bergen, Norway, this year in the convenient atmosphere of the Grand Hotel Terminus.

Hovedinnhold
The main goal of this 13th annual symposium on visualization was to present novel techniques for the visual exploration, analysis, or presentation of digital data, originating from scientific disciplines, industry, or daily life, and to be a meeting place for researchers as well as users of visualization. The ideas presented at EuroVis 2011 are collected in proceedings, which are published as a special issue of the prestigious Computer Graphics Forum journal.
From initially 194 submissions, and after an extended, double‐staged reviewing process by the international program committee together with many additional reviewers, the 3 paper chairs from Boston, Eindhoven, and Bergen, selected 54 papers for presentation and publication at EuroVis 2011. Even though the overall acceptance rate of EuroVis was at the competitive level of ≈28% also this year, still the number of presented papers is an all‐time record. Moreover, it is an interesting development that by now the two primary annual conferences in visualization, i.e., the IEEE Visualization Conference in the US and EuroVis in Europe, are approximately equal in terms of the numbers of submitted and presented papers.
This substantial amount of high‐quality papers also attracted the record number of 210 participants from 23 European, American, and Asian countries to Bergen.
A committee comprised of three senior experts in visualization, from Canada, the US, and Germany, has selected three best papers of EuroVis 2011:
1. W. Berger, H. Piringer, P. Filzmoser, M. E. Gröller: Uncertainty‐Aware
Exploration of Continuous Parameter Spaces Using Multivariate Prediction
2. E. Anderson, Kr. Potter, L. Matzen, J. Shepherd, G. Preston, Cl. Silva: A User
Study of Visualization Effectiveness Using EEG and Cognitive Load
3. S. Nagaraj, V. Natarajan, R. S. Nanjundiah: A Gradient‐Based Comparison
Measure for Visual Analysis of Multifield Data
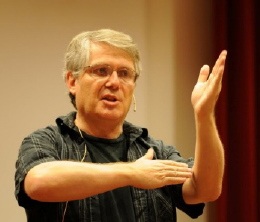
In addition to the papers track, two invited talks were highly interesting. Comics theorist Scott McCloud opened the symposium with a lively and highly inspiring lecture. Eventually, EuroVis 2011 was concluded by senior scientist M. Eduard Gröller with relevant reflections upon heuristic approachs in scientific work. The symposium was furthermore complemented by an industrial track. Here the stage was given to the sponsors of EuroVis 2011 for explaining their needs with respect to visualization and associated new challenges for visualization research. EuroVis 2011 was preceded by a one‐day EuroVis workshop on Visual Analytics (EuroVA 2011), which is perhaps the most energetically emerging new corner in visualization research.
All in all, EuroVis 2011 was considered a highly successful event. Prof. Thomas Ertl, the chairman of the Eurographics Association, i.e., one of the two major supporting associations next to IEEE vgtc, said during the social event in Fløien Folkerestaurant that EuroVis 2011 clearly was the best‐ever event in that series. EuroVis 2011 was organized by the visualization research group at the Department of Informatics, University of Bergen, in cooperation with Christian Michelsen Research, and substantially supported, amongst others, by the Norwegian Research Council. Moreover, EuroVis 2011 would have been impossible without the generous support of sponsors Statoil, Havforskningsinstitutet, Schlumberger, MedViz, Morgan Kaufmann, GE Vingmed Ultrasound, Siemens, NorSIGD, VRVis, Rocksource, IBM Research, VACCINE, and NVidia. The organization also benefited from the great help of many student volunteers. The event showed that Norway has become an important contributor to the scientific discipline of visualization.
Helwig Hauser and Ivan Viola
EuroVis 2011 chairs

