Micro Rain Radar MRR-2
Continuous measurements of droplet size distribution and precipitation intensity on the roof top observatory at GFI

Main content
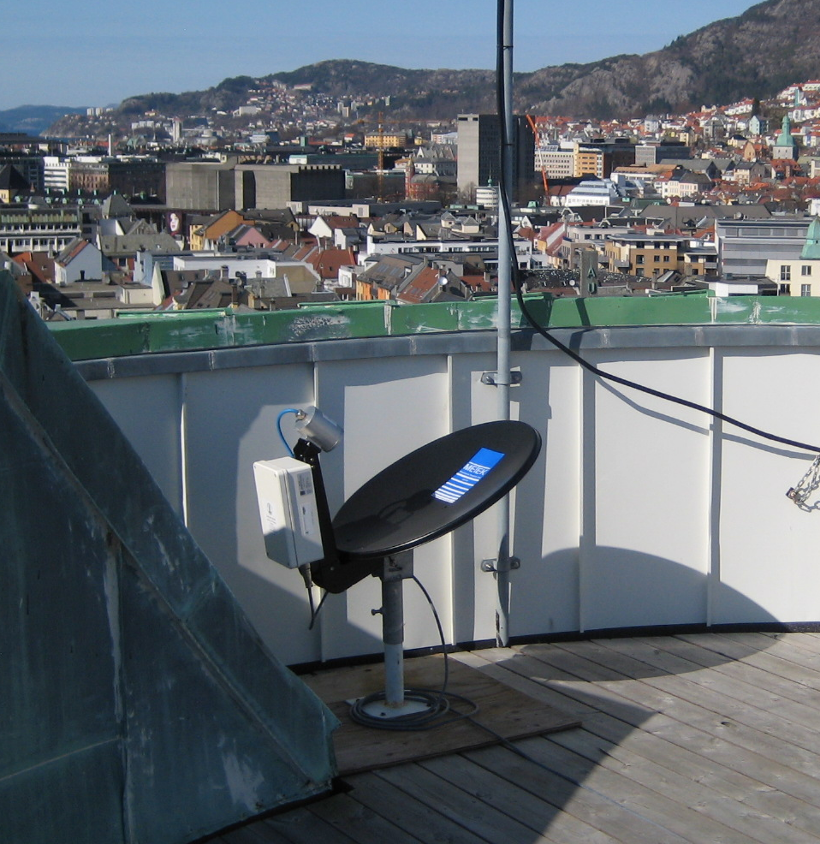
The micro rain radar is a small vertical pointing Doppler radar from Metek. It is used to estimate the raindrop size distribution at different heights and thus enables investigation of the formation of rain.
The radar operates at a frequency of 24 GHz in the FMCW (frequency modulated continues wave) mode with a low emit power of 50 mW. The vertical range resolution is currently set to 100 m and the measurements are made up to 3000 m above ground.
For each range bin the Doppler spectrum is measured. The Doppler spectrum gives the distribution of backscattered power versus Doppler velocity (= fall velocity of particles). Since the fall velocity of raindrops as well as their backscatter signal is known, the Doppler spectrum can be converted in a raindrop size distribution. From the raindrop size distribution parameters like rain rate can be estimated.
The real-time image gives a 12 hour time-height cross section of average fall velocity and radar reflectivity with a temporal resolution of 1 minute and a vertical resolution of 100 m. In general the fall velocity is low (1-3 m/s) for snow and drizzle, whereas for rain values above 4 m/s are expected. The observed fall velocities might be superimposed by vertical air motion, like strong updrafts in thunderstorms. In this case the retrieved raindrop size distributions will be not representative.
From the 200 m level the rainfall rate at the surface is estimated. The rain rate based on 1 minute measurements as well as the accumulation of rain for the day is shown in the lower graph. A logarithmic scale is used. Note that rain rate estimation is only correct for rain, not for snowfall. Especially melting snow at 200 m (temperature at ground between 4 and 1°C) may cause a considerable overestimation of the rain rate.
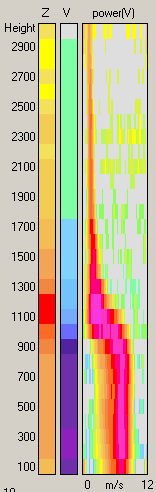
On the right side the raw measurements from 10 seconds are displayed. Z shows the vertical profile of radar reflectivity in dBz, V the vertical profile of fall velocity in m/s with the corresponding colour code as in the time-height cross-section. The graph power(Z) shows the Doppler spectra for each of the height bins. The colour scale is in arbitrary values, but red and purple colours indicate higher intensity for the respective velocity class. In the example the distribution is very narrow and particles have a fall speed of about 1-2 m/s. The other green and yellow patches are caused by signal noise.
The other example shows the real time observations for a strong rain event with narrow distribution and low velocities in snow above 1300 m height and wide distribution and fast velocities in rain below 900 m. In between is the melting layer where snow melts into rain indicated by an increasing fall velocity and a peak in radar reflectivity caused by wet melting snow.
The continuous measorement with the MRR at GFI started in April 2010. The actual data are visualized and updated every 5 minutes and kan be viewed here.
Contact at GFI:
Joachim Reuder
Anak Bhandari